At end of 4th Game, a glimpse of this tournament has panned. So far… Indicator Points Avg 25.28 Its 6pts. less than this year’s figure Avg(31.35) R/O 4.77 B/W(St.Rate) 31.82 Here its 7 pts less than this … Continue reading
Analysis
At end of 4th Game, a glimpse of this tournament has panned. So far… Indicator Points Avg 25.28 Its 6pts. less than this year’s figure Avg(31.35) R/O 4.77 B/W(St.Rate) 31.82 Here its 7 pts less than this … Continue reading
IPL 6 After 74 games the average runs scored by teams batting first has reached 155.88. In my last post,(end of 25th game), the average was 149. Now in those 74 games, 38(51.35%) chased successfully. And, so far 44 times (59.46%) … Continue reading
[local /wp-content/uploads/2013/04/Balls-faced-on-average.flv nolink] A look at Test batting for all countries, with consumption of balls as primary discussion. There has been rise in No. of overs bowled /1st Innings in last few years. Therefore the obvious curiosity whether … Continue reading
This gallery contains 1 photo.
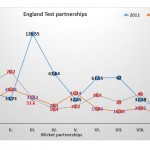
In the 90s in the audio industry , they had normal, chrome and metal audio blank tapes, with metal audio tapes being the highest quality for recording songs. Maxwell tapes had the best chrome/metal product –and the most saleable … Continue reading
IPL 6 – At the end of 25 games 13 times teams were asked to chase >150 and only 4 succeeded. Last year at end of 25games, 15times teams were asked to chase >150 and only 4 succeeded. Now, … Continue reading
[local /wp-content/uploads/2013/04/2-FILM-AND-PROGRAMING.flv nolink] A script should be written like a computer program than you would have film with an air-tight story & screenplay leading to a good a film!. A program has many languages, very … Continue reading
A Brief stats on IPL So far in this IPL (2013), at the end of 23 games, 12 times teams were asked to chase >150 , and only 4 succeeded in chasing those targets. Last year (2012) in 73 games … Continue reading
[local /wp-content/uploads/2013/04/why-aussies-lost.flv nolink] Australia’s performance in the series. Indices Aus(Bat) India(Bat) Inns 8 7 Avg 25.90 43.80 St.rate 44.41 62.13 R/o 2.67 3.73 B/w 58.32 70.50 Low Eco Rate x Low Strike Rate 155.54 263.25 ball/ss 4.57 3.56 … Continue reading
India’s overall performance in the series. [local /wp-content/uploads/2013/04/Ind-Aus-series-Review-Part-I.flv] Indices Aus(Bat) India(Bat) Inns 8 7 Avg 25.90 43.80 St.rate 44.41 62.13 R/o 2.67 3.73 B/w 58.32 70.50 Low Eco Rate x Low Strike Rate 155.54 263.25 ball/ss 4.57 3.56 … Continue reading
Another Test, another challenge, but same old story on day 1 of 3rd Test. Session wise First day-stats of all Test matchs in this series. First session Second session 3rd Session 1st Test 2nd Test … Continue reading
Part I video [local /wp-content/uploads/2013/03/TEST2011-13A.flv] Part II video [local /wp-content/uploads/2013/03/TEST2011-13INDICES.flv] Test matches 2011 2012 2013 Tests 39 42 10 Inns 147 158 35 400 score 27 34 9 100 overs 55 64 14 Avg … Continue reading
The Sweep shot: Unlike other batting skills, the sweep shot needs to be practiced on regular basis to procure result, otherwise while executing this skill in a match, batsmen often tend to miss and miscue them. This leads them to avoid … Continue reading
2nd Test.Hyd scorecard The averages(after 2 Tests). Primary Indices India Australia Inns 3 4 Avg 51.14 25.36 st.rate 58.56 43.61 r/o 3.52 2.62 b/w 87.32 58.15 ball/ss 3.72 4.58 ss/balls 26.91 21.83 1ss 15.15 13.27 4ss 7.70 … Continue reading