Since 2009, India 1st Inn Avg Score is 469 Runs while batting second in a Test match. In these 15 Test matches, 10 times India scored more than 400 Runs.
List of 1st Inn score (batting second) since 2009.
Test Ranking. Currently India is at No.1 with 125 points, and England is at No.3 with 117 points, a point behind 2nd ranked South Africa. If England wants to become the No.1 Test side, then they just have to win … Continue reading →
In last 2 years( 25 Test matches), England’s Avg 1st Inn score is 397, & a score of 350 or more have been achieved regularly(17 times) by them, and so far they haven’t lost a single game with that score. … Continue reading →
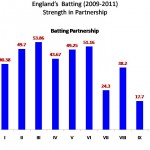
List of Batting -Partnership since 2009. Wkt Inns Avg (100+)Partnership I 40 40.38 4 II 40 49.7 7 III 37 53.86 7 IV 36 43.67 6 V 36 49.25 5 VI 36 51.16 8 VII 31 24.3 1 VIII … Continue reading →
India beat West Indies (1-0) in 3 Test series, and winning their 2nd consecutive series against West Indies.
India’s Key Performers
Rahul Dravid In every inning he came in to bat inside the 10th over, & thrice in his presence team almost scored 100 runs, yet it didn’t allow India to reach 300 once. If Dravid can play a bit faster, at least 1 scoring shot in less than 4 balls, & bat long enough, then Mr. Consistent can be more productive.
VVS Laxman Like Rahul he too came into bat when India were in trouble, but his contribution as a batsman and as a player was far more than Dravids.
In last 2 test matches his scoring rate was much better than his strike rate, as he was able to rotate the strike ( last 2 Test matches featured 60 % singles/ 25 +singles/100 balls). If Laxman, like Dravid play more aggressively then India’s lower order can be far more effective than other nation.
Suresh Raina Considering that he came into Test series with a very poor ODI series, this was an excellent performance, truly coming of age for this young batsman.
His performance marked the making of a Test player. Involved in most 100 partnerships(3), and he always performed when team where in trouble. His excellent scoring rate (3.43) allowed those partnerships to grow.
Praveen Kumar Accurate and effective, without bowling a single error ball (no ball & wide).
Ishant Sharma Making an excellent comeback to Test cricket. Consistent pace and accuracy was the key factor in his bowling. His accuracy fetched him 10 straight ball dismissal, adding to this 54% of victims were in single figure!.
Darren Sammy : Excellent performance, both as a leader and as a player. His captaincy will only get better provided he can be given more time and games to lead in all format (at least ODI & Tests)
Openers : West Indies opener provided the only 50 runs stand for the 1st wicket in this series (Indian opener failed, avg 9.16). They need to back themselves while playing aggressively. With more opportunities
West Indies selectors need to give more opportunity(at least 3 to 4 Test series) to these selected openers. Barath & Simmons are technically sound openers, and they can be the answer to their Batting problem.
Darren Bravo : Bats very similar to Chanderpaul, slow and steadily building partnerships.
Samuels & Chanderpaul : Their experience can be handy for West Indies in near future, and if they are able to play a little faster, than it is possible for team to score 300 consistently, and give themselves enough opportunity to win Test matches….which has been a rarity for them.
Fidel Edwards : Expensive but effective, and if turns consistent than he can be very lethal.
Ravi Rampaul : Excellent performance, especially with the new ball. It is very difficult for one to remember a West Indian genuinely swing a ball, as one associates seam and bounce from Caribbean bowlers. Rampaul has the ability to control his swing.
Devendra Bishoo : It’s a rarity that a rookie leg spinners is level headed, in-expensive, yet productive. Troubled experienced batsmen with his basic leg spinning ball.
In cricket, a team’s platform has to be build by openers so that they along with middle order can produce a total, which will give enough opportunity for their bowlers to defend and win games in all format of cricket.
Team’s 50% (and more) of winning depends on their openers.
In openers category, one also should include opening bowling pair, as they are Fielding Team’s Openers!.
1.2.5.6 – Runs scored of first 2 and last 2 balls of an over. This is an unique indicator, very handy in analyzing Limited Over Matches. In this we find the average Runs scored for each of these balls(first,second, second … Continue reading →
A Bowler or a Team, conceding 3 or less runs in Consecutive overs of an Inning.
Here one can change the conceding runs (3) according to one’s requirement in various format (Test match is 3 or less runs per over, ODI is 4 or less runs per over, and T20 is 5 or less runs per over) and watch how Fielding Team and their Bowlers maintain discipline.
Example for Calculating (C 3 ) Formula:
Glen McGrath (Australia in Pakistan, 3- Test series, 1998)
Inns : 4
Overs (Balls) : 120.5 (725)
Maiden Overs : 34
C M (Overs) : 6
C 3 (Overs) : 32
Runs : 344
Wickets : 12
Formula
C 3 (%) = 32 / 121.5 = 26.56 %
Note: Extras(byes & leg byes) are not included in this indicator, but error balls are (no balls & wides) included
A maiden over followed by another maiden over is known as “one’( C M) consecutive maiden over.
Successive and Consecutive have two different meaning. Here is an example of both.
If over No. 1 to 7 are all maidens, then there are 6 Consecutive Maidens, and 7 Successive Maidens, but never 7 Consecutive Maidens.because the first maiden over is not following any over!.
Example for Calculating (C M ) Formula:
Over No.
Bowler
Runs Scored
1
McGrath
0
2
Gillespie
0↓
3
McGrath
0↓
4
Gillespie
0↓
5
McGrath
0↓
6
Gillespie
0↓
7
McGrath
0↓
Formula:
Glen McGrath (Australia in Pakistan, 3- Test series, 1998)
Runs per Over (Economy Rate) : Total Runs conceded in an Over. From Bowler’s perspective, extras (byes and leg byes) are not counted as run, hence not added to his tally of runs conceded in an over, but error balls … Continue reading →
Scoring Shot (Bowler) : Bat run conceded of a Single Ball . They are 1s, 2s, 3s, 4s, 6s , & any added runs acquired from overthrows. Extras are not added to Bowler’s scoring shot. Scoring Rate : Balls … Continue reading →
Balls per Wicket or Bowling Strike Rate : Total Balls divided by Total Wickets in an Inning. An essential part of Bowling Analysis, also called as a Strike Rate, suggesting how effective and dangerous a bowler performs (any format). A … Continue reading →
Bowling Average : Total Run (conceded) divided by Total Wickets taken by a Bowler in an Inning. A Bowling Average determines how much a bowler concedes in an inning, or a match, or a series, and so on, … Continue reading →