
This gallery contains 5 photos.
‘Technique’ is the most hyped & emphasised jargon used in the cricketing world. To understand technique, one has to know the grammar of cricket.., in batting, bowling and fielding Grammar is very important, I feel, since technique can always be tweaked for adapting to situations.But grammar …no. Grammar is similar to the laws of nature. For instance people do not walk backwards, or one cannot sit and bat, or that you do not apply sweat on rubber/tennis ball for it to swing!.
And Technique should be related to scoring runs, because in reality scoring runs and not the technique, should be the paramount concern for a batsman.
There are only two ways a batsman can bat viz. with a vertical bat & with a horizontal bat.
Let’s start with batting From the inception of cricket, short-straight in line-high- bounce deliveries were always difficult to score off. In fact more than 50% of the batsmen would get out to this kind of a delivery. And if not, they would be scared and would sway away, to avoid getting hit. I reckon this technique still remains the favourite amongst fast bowlers provided it exceeds a certain height and speed. Otherwise it becomes a liability for them and their team.
However, batsmen in the last few years have found a new technique to score runs (not necessarily to counter this kind of a delivery) viz. the slap shot. Either the flourishing format of T20 games, childhood inheritance or the inability to score runs by playing conventional shots could have been responsible for this A cross batted swat/slap shot: – a few years ago this technique was considered to be incorrect by some experts. But now it has become a beautiful jargon for them, since it is consistently fetching runs …in plenty.
According to me, the do’s of the batsmen are :
* Improvising their technique to help them score runs in all conditions, against all types of bowling, and not to help defend their wicket. However it is the pressure created by a situation that makes a player weak or strong, and their inability to control the situation leads to their downfall.
* Improvising their technique to return to form if they lose it. This can be done either by watching other players (similar to him either in technique or in temperament) live in action or in videos, or watching his own videos, or watching himself in the mirror while playing. In the last scenario, a coach or an assistant should be there to monitor his technique.
* Trying to find common patterns and imbibing them while watching other players play. The idea is not to replicate them.
Technique is the most hyped and emphasised jargon used in world cricket…..
And the reason for this might be the length of the game (too long, and too slow) or – at any given moment there are three different cricket skills viz. batting, bowling, fielding, employed by three different players play and they all have to synchronise to produce results. This can be done without scoring a run or getting a wicket.
I personally feel when these 3 skills merge together then technique becomes the primary object of discussion by everyone, as they are pitted against each other every time. Sometimes it’s strange when a bad ball gets a wicket due to a bad shot played, or a good shot played and the fielding is excellent. Also good balls go for a boundary.
If closely observed, every player changes his technique over a period of time, and lately they have been doing in the midst of their innings. At most times its so subtle that they are not aware of it. Therefore any player, from any country, playing in any condition and any situation, can have his own technique provided he is consistently successful in its execution. Which is why change is bound to happen. We are humans, not machines, and there are various factors that lead us to change, automatically.
However he needs to find out what has helped him to succeed while playing. Sometimes it’s not easy. Hence he needs to alter a few things, try out new things, which would help him to find the problem and the solution to it. If he doesn’t try, then he won’t know. Therefore decision making becomes paramount. And once his decision produces the result (success or failure), then he becomes confident to understand whether or not to apply that skill. He would also know what is good for him for that moment and how to employ a particular skill at a given time. This confidence is the key for him to move on.
Now, going back to the type of shots a batsman can play viz. vertical & horizontal bat shots.
Top hand is his guiding hand, or the radar-hand, and the bottom hand is the power hand. With the help of supple wrists, a batsman can be more effective in playing either horizontal or vertical shot. In cricket, unlike some other sports. both hands and feet are used simultaneously.
For instance, in badminton, where though the shuttlecocks are light, it is almost impossible to play with both hands or take turns to play with either hand. Why do you think so ? Because though the shuttlecock goes up fast it comes down slowly. And since the length of play court is only 13 meters, it is never easy to play with both hands. In tennis, the play court is longer, and instead of the shuttlecock, there is this soft tennis ball which travels faster. The racquet is big and powerful. Still most players use both their hands to full effect and success.
I wonder if these racquet sports’ techniques can be used in cricket to deal with the short-vertical-fast-bouncy-ball !
A quick look at the table below shows on which type of deliveries the horizontal or the vertical shots can be played. It is interesting to note here that the vertical shots cannot be played to a high rising ball.
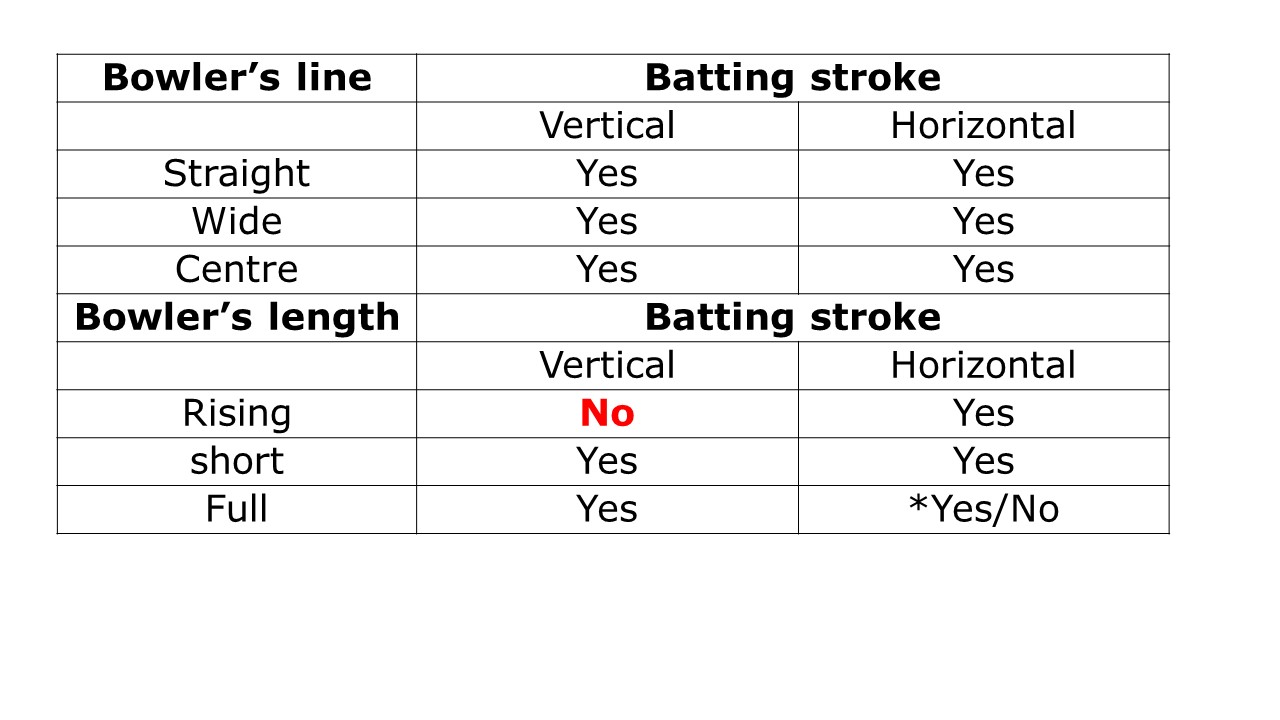
*Please also note that it is not possible for a batsman to play a defensive shot with a horizontal bat (unless it is ‘blind cricket’)
If a batsman can anticipate short pitch deliveries coming towards him, and is able to move away and play horizontal shots, then it can be dealt with. But how does one practice without knowing when a bowler will pitch it short or full, slow or fast ?
The answer to this could be as follows :
1- If a batsman stands with a high back lift (a la Gooch), his chances of playing either vertical or horizontal shots is greater, than if his bat is grounded. This is because the bat is lighter when it is not grounded. (but please note that the top hand needs more control to guide the ball. Hence the grip needs to be firmer when guiding)
2- A batsman should stand open-chested (2 eyed stance) with his back leg covering almost the middle-off stump, and the front leg wide outside leg stump. This is how Kepler Wessels used to stand (But beware of the gap between the legs, since this allows the bowlers to bowl in-swingers & Yorkers)
3- Hand Power: Strong hands with supple wrists are important here. Like the drummers in bands who play the drum solo with great flexibility and speed without banging the drum plates. Also badminton players who use their wrists very late to guide the shuttle.
4- Balance of the feet – The way the racquet sports players allow their body to be in a position to play either vertical or horizontal shots or leave them is amazing. In cricket, I am not sure if the umpire will allow a batsman to move constantly like the racquet players do. But if they allow, then the batsmen need to move like them, and balance themselves to apply complete power to play horizontal shots.
However the fact of the matter is every batsman on this planet was and is conditioned to bat with a conventional stance & a still position
The 4 techniques mentioned above have definitely helped the current batsmen to perform better, as can be seen in the few examples below. These batsmen have great control over the vertical and horizontal shots and it doesn’t matter which format they excel in……..only scoring runs matter, irrespective whether it is in TEST, ODI or T20.
A batsman can only play with a vertical bat & with a horizontal bat!.
![]()


Here are a few examples of batsmen who have great control over the vertical and horizontal shots –
In recent times ‘slap cover drive’ has become a regular method with a lot of batsmen, David Warner is one of them. In past even Ricky Ponting uses, though with a vertical bat which looked very conventional to naked eye…
* Roelof van der Merwe – He was the first batsman I saw who effectively played the “slap shots”, dangerously, but successfully (in IPL 2009). As i distinctly remember Morne Morkel (Rajasthan)’s one spell getting “mashed” by Van der Merwe, as he played those gruesome shots over point boundary with his head turned to the leg side. This ordeal continued repeatedly in that IPL!!.
* Tilakratne Dilshan – Plays the “scoop” shot regularly, going on knee and slapping the ball over keeper’s head, and has been employing it in all type of pitches.
* Darren Sammy – He has the unique ability to move across the crease to play big shots. He doesn’t shuffle before the ball is bowled. His feet move like those of tennis players, as he goes deep inside and across the crease to good length balls to slap them over long on or midwicket. Whenever he plays these shots, it appears that he “lift-drag” these balls over the ropes. The bouncers are treated with horizontal jabs, similarly to tennis players, he stands tall with legs apart, and slaps flat batted. So far he has been very successful in suitable conditions, and he hardly miscues, or mis-times any of his power hits.
His style of batting is the most effective way to attack bouncers, and so far he has been very successful. We would see more of this kind of batting next month in England where pitches would be much livelier than Sammy has ever played in his short Test career.
*Virendra Sehwag: Master of vertical shots. His ability to move away from the ball, and yet time and place them where he wants signifies his class as an top class batsman.
* Dwayne Bravo – I haven’t seen any batsman who plays everything vertically except the pull and the hook shot, which is not a regular technique used by him. And like David Warner, he doesnt play a sweep shot.
* David Warner – A fine example of a player who plays the horizontal slap shots very successfully. Phil Hughes is another player who plays this shot, but with less consistency. A drive shot from Warner is less vertical, and more horizontal, since they powered by his bottom hand. This suggests that there is a gap between his bat and his body allowing him more space to play. Yet he’s hardly been out L B W or BOWLED…which is quite interesting, considering he is a left-handed opener, who generally are prone to these kind of dismissals. For that matter even Phil Hughes has had less of these dismissals. As mentioned earlier, we haven’t seen David Warner play a sweep shot.
* Shane Watson – The only batsman in recent times who has the ability to change his technique in the middle of his innings with great success. To me, it seems that he is doing this to merely score runs and not stay at the crease. Lately he has developed a unique way of playing an on-drive. Its more of a “slap straight on-drives” and its very eye catching.
An on-drive is the most precious skill in batting, and the most difficult shot for a batsman to master.
Watson’s uniqueness comes from his bottom hand, which guides the ball very late, as he comes over the ball with a straight bat and places between the umpire and the non-striker. The late adjustment of his wrists enables him to guide the ball straight, not always along the ground but always in gap. It appears that his approach to batting is only to seek runs.
In the past, batsmen like Graham Gooch changed their batting stance, so that they could be more consistent. Gooch employed this high back lift technique, which helped him score faster. And big scores followed consistently, on all surfaces. His statistics showed that more runs were scored with this high back lift technique.
Then there were batsmen like Kepler Wessels, Jack Russell, Jimmy Adams, & Chanderpaul(current) who approached their batting with a very unique batting stance. But this uniqueness was to safe guard their wicket, and not to necessary to score fast or more runs !. Some players in the past had weird techniques, and it helped them do the basics, rather than play aggressively.
Finally I am of the view that batsmen should add these different skills for attacking, not losing their basic skills in the bargain. They should keep on improving these new skills so much so that it becomes a part of their regular skill set. For a batsman, technique is to score runs for his team & himself, and not defend his wicket.
To add to this argument, here is a link to an article sent by my brother, which explains the time it takes for a batsman to play horizontal and vertical shots.
http://www.economist.com/
I found a very interesting sub-link in this article –
http://www.nature.com/neuro/
This is about the visual-motor system, according to neuroscience. I hope the above 2 articles help coaches train the batsmen in handling quality fast vertical deliveries. I also believe that regular practice and simulation will be of great help.
Here is a link to video of how to play H V shots.
http://youtu.be/TZ3eWR9fvSM
embedded by Embedded Video
Run- outs(How to reduce them)
Running between wickets is important, so is the speed in which they run. But these are not as important as ‘quick decision-making’. The decision to take or not take a run
Here hesitancy is always the culprit, leading to confusion and finally …run-outs
To reduce this, players need to understand each other well.
Hence, during training, players need to practice in pairs. This enables them to understand each other well when they run between wickets, thereby reducing run-outs drastically
Hence, in training if players can practice together in various set of pair, than understanding of running between wickets becomes stronger, and run-outs can be reduced to larger extend.
In a cricket team, openers usually have a better understanding of each other for the following reasons :
1- They know in advance that they have to bat together. This gives them more time to understand each other.
2- The initial period (first 5 overs of a test match) of an innings enables them to find out about each other’s strengths & weaknesses while taking runs.
1- 3- The pace of an innings is set by them. Constant rotation of the strike is a major factor for teams to set the trend early in the innings, especially in a Test match. It also allows the players, who follow, to bat comfortably.
If batsman have better understanding than 18% (all formats dismissals)can be reduced.
India-West Indies analysis
India’s third consecutive (fourth successive) series win against West Indies, & West Indies are the third nation that India have won successive series against, before this, India defeated England in successive series(1971-1972) & then in early part of 1993 when they trounced Sri Lanka(Jan) first at home and then in Sri Lanka (July).
At end of this series, Indian batsmen have scored 77 centuries against West Indies, & 101 was against India for West Indies batsmen.
Dhoni”s suggestion on producing spinner’s track in India must have been influenced from No. of L B W & Bowled dismissals his new spin pair picked in this series. Both Ojha/Ashwin picked 14 L B W and 6 Bowled wickets, and in all there were 29 dismissals (16 L BW + 13 Bowled).
India’s Performance
|
Batsmen |
In |
Runs |
H.S |
100s |
50s |
Balls |
S.S |
4.6(SS) |
Play-Role |
50+ |
100+ |
|
Dravid |
5 |
319 |
119 |
1 |
2 |
617 |
213 |
27.2 |
761 |
6 |
1 |
|
Laxman |
5 |
298 |
176* |
1 |
1 |
497 |
208 |
22 |
669 |
4 |
2 |
|
Sehwag |
5 |
245 |
60 |
0 |
3 |
249 |
117 |
33.3 |
429 |
5 |
0 |
|
Tendulkar |
5 |
218 |
94 |
0 |
2 |
397 |
114 |
24.2 |
396 |
5 |
0 |
|
Gambhir |
5 |
195 |
65 |
0 |
2 |
286 |
103 |
27 |
446 |
6 |
0 |
|
Dhoni |
5 |
165 |
144 |
1 |
0 |
241 |
97 |
12.5 |
258 |
0 |
1 |
|
Ashwin |
4 |
121 |
103 |
1 |
0 |
163 |
62 |
15.2 |
217 |
1 |
0 |
|
Kohli |
2 |
115 |
63 |
0 |
2 |
225 |
79 |
8.1 |
252 |
2 |
0 |
|
Total |
5 |
1840 |
176* |
4 |
12 |
2925 |
1047 |
181.17 |
1840 |
15 |
2 |
|
Bowler |
Inns |
O |
M |
R |
W |
Best |
4WI |
5WI |
S.S |
4.6(SS) |
C3 |
L 3 |
LBW |
B’wld |
<10 |
|
Ashwin |
6 |
170 |
22 |
504 |
22 |
6-47 |
2 |
293 |
46.6 |
61 |
107 |
7 |
6 |
6 |
|
|
Ojha |
6 |
177.2 |
38 |
450 |
20 |
6-47 |
2 |
246 |
48.6 |
74 |
119 |
7 |
0 |
6 |
|
|
Yadav |
4 |
50.3 |
7 |
191 |
9 |
4-80 |
1 |
0 |
8 |
23 |
0 |
6 |
4 |
||
|
Ishant |
6 |
109 |
24 |
337 |
5 |
2-95 |
0 |
221 |
68.1 |
27 |
65 |
2 |
0 |
1 |
|
|
Aaron |
2 |
32 |
4 |
129 |
3 |
3-106 |
0 |
58 |
22 |
5 |
14 |
1 |
2 |
||
|
Total |
6 |
582.2 |
98 |
1824 |
60 |
6-47 |
1 |
4 |
938 |
207.14 |
189 |
354 |
16 |
13 |
19 |
West Indies performance
For the first time in some years, West Indies bowlers failed to pick big wicket haul, (4 or more) in an inning. In this series, the best bowling figure/inning came from their captain D Sammy (3/35).
Since 2007, Darren Sammy has been the most prolific bowler for West Indies. Apart from Fidel Edwards no bowler has picked more 4wickets haul than Sammy.
Edwards on the other hand had a very poor series, surprisingly with his slinging-action he could only get one L B W & Bowled dismissals(Sammy had 5 Bowled dismissals). Irrespective of where he bowled from (over the wicket, or around the wicket), or to whom (Right hand batsmen or Left hand batsmen) his radar was consistently down the leg side.
Darren Bravo’s 2nd century at Eden Gardens was 100th century for West Indies against India in Test history.
He was the most prolific run scorer from either side. His tally of 404runs helped West Indies produce 47.2% of Team Runs in this series(Role-play). Role-play : 861Runs were scored by the West Indies team while he was batting, it is also the most by an player from either side. Apart from Bravo, K Edwards & K Brathwaite contributed immensely for West Indies, although their tally of runs were not much to talk about, yet, it’s runs scored in “Role-play” produced large score for West Indies.
|
Batsmen |
In |
Runs |
H.S |
100s |
50s |
Balls |
S.S |
4.6(SS) |
Play-Role |
50+ |
100+ |
|
Bravo |
6 |
404 |
166 |
2 |
0 |
735 |
216 |
47.4 |
861 |
1 |
4 |
|
Chanderpaul |
4 |
216 |
118 |
1 |
0 |
354 |
122 |
21.2 |
392 |
1 |
2 |
|
Edwards |
6 |
227 |
86 |
0 |
2 |
484 |
116 |
30.1 |
451 |
1 |
1 |
|
Brathwaite |
6 |
194 |
68 |
0 |
2 |
598 |
123 |
17 |
491 |
2 |
2 |
|
Samuels |
6 |
185 |
84 |
0 |
2 |
295 |
84 |
28.1 |
313 |
0 |
1 |
|
Barath |
4 |
128 |
62 |
0 |
2 |
267 |
67 |
18 |
262 |
1 |
|
|
Powell |
4 |
106 |
81 |
0 |
1 |
222 |
64 |
12 |
214 |
0 |
2 |
|
Sammy |
6 |
110 |
42 |
0 |
0 |
111 |
51 |
9.5 |
191 |
0 |
0 |
|
Total |
6 |
1824 |
166 |
3 |
9 |
3494 |
938 |
207.14 |
1824 |
3 |
6 |
|
Bowler |
Inns |
O |
M |
R |
W |
Best |
S.S |
4.6(SS) |
C3 |
L 3 |
LBW |
B’wld |
<10 |
|
Rampaul |
4 |
65.3 |
6 |
229 |
8 |
3-56 |
129 |
26 |
21 |
39 |
0 |
2 |
1 |
|
Sammy |
4 |
75 |
4 |
313 |
9 |
3-35 |
159 |
44.2 |
17 |
33 |
1 |
5 |
3 |
|
Samuels |
5 |
90 |
0 |
341 |
7 |
3-74 |
226 |
22.4 |
23 |
47 |
1 |
2 |
3 |
|
Bishoo |
5 |
137 |
10 |
436 |
7 |
2-55 |
283 |
30.6 |
48 |
82 |
1 |
0 |
1 |
|
Edwards |
5 |
83.2 |
9 |
333 |
5 |
1-28 |
168 |
45.2 |
15 |
39 |
1 |
1 |
1 |
|
Total |
5 |
484.2 |
30 |
1840 |
41 |
3-35 |
1047 |
181.17 |
129 |
254 |
4 |
11 |
10 |
Explanation of primary indices used in these tables
Explanation of secondary indices
A – < 10: Low score dismissals (Bowler’s table).
B – L B W (Bowler’s table) : No. of L B W dismissals for bowlers
C – BOWLED (Bowler’s table) : No. of Bowled dismissals for bowlers.
D – Role-play : Batsmen’s (Begin Score)- (End score) = Role-Play
3rd Test, Mumbai, West Indies in India –Nov (22-26),2011. Result : Drawn
|
West Indies (1st Inn) 590 all out (184.1) overs |
Runs |
Balls |
S.S |
4.6(SS) |
(Begin- Score)-(End-Score) = Role play |
|||
|
A Barath 1-137(52.5) |
c Dhoni b Ashwin |
62 |
148 |
32 |
8 |
0 |
137 |
137 |
|
K Brathwaite 2-150 (59) |
c Kohli b Ashwin |
68 |
184 |
36 |
8 |
0 |
150 |
150 |
|
K Edwards 3-314(103.5) |
c Dhoni b Sharma |
86 |
165 |
41 |
13 |
137 |
314 |
177 |
|
D Bravo 5-518 (164) |
c Dhoni b Aaron |
166 |
284 |
98 |
17 |
150 |
518 |
368 |
|
K Powell 4-474 (150.1) |
c Dhoni b Ojha |
81 |
149 |
51 |
9 |
314 |
474 |
160 |
|
M Samuels 9-566 (177) |
c Dravid b Ashwin |
61 |
103 |
30 |
9 |
474 |
566 |
92 |
|
C Baugh 6-524 (165.5) |
b Aaron |
4 |
6 |
1 |
1 |
518 |
524 |
6 |
|
D Sammy 7-540(169.4) |
c Dhoni b Aaron |
3 |
6 |
3 |
0 |
524 |
540 |
16 |
|
R Rampaul 8-563(174.1) |
c Kohli b Ashwin |
10 |
14 |
4 |
2 |
540 |
563 |
23 |
|
F Edwards |
not out |
11 |
27 |
7 |
1 |
563 |
590 |
27 |
|
D Bishoo 10-590(184.1) |
b Ashwin |
12 |
21 |
5 |
2 |
566 |
590 |
24 |
|
Extras 26(b 8, lb 16, nb2) |
Scoring shots 309(198x1s, 34x2s, 6×3, 70x4s) |
|||||||
|
India 1st Inn |
O |
M |
R |
W |
S.S |
4.6(SS) |
L 3 (%) |
C 3(%) |
|
I Sharma |
32 |
9 |
84 |
1 |
37 |
12 |
62.50 |
28.13 |
|
V Aaron |
28 |
4 |
106 |
3 |
48 |
18 |
46.43 |
17.86 |
|
P Ojha |
48 |
10 |
126 |
1 |
71 |
13 |
62.50 |
29.17 |
|
R Ashwin |
52.1 |
6 |
156 |
5 |
95 |
17 |
63.34 |
34.55 |
|
V Sehwag |
16 |
1 |
61 |
0 |
37 |
7 |
56.25 |
37.50 |
|
V Kohli |
2 |
0 |
9 |
0 |
6 |
1 |
50.00 |
00.00 |
|
Tendulkar |
6 |
0 |
24 |
0 |
15 |
2 |
66.67 |
33.33 |
|
Byes |
|
|
8 |
|
|
|
|
|
|
leg byes |
|
|
16 |
|
|
|
|
|
|
Total |
184.1 |
30 |
590 |
10 |
309 |
70.3 |
59.75 |
39.11 |
|
India (1st inn) 482 all out (135.4)overs |
Runs |
Balls |
S.S |
4.6(SS) |
(Begin- Score)-(End-Score) = Role play |
|||
|
G Gambhir 2-138(34) |
c Baugh b Rampaul |
55 |
99 |
27 |
8 |
0 |
138 |
138 |
|
V Sehwag 1-67(14.3) |
b Sammy |
37 |
50 |
17 |
3.1 |
0 |
67 |
67 |
|
R Dravid 3-224 (60.5) |
b Samuels |
82 |
149 |
43 |
11 |
67 |
224 |
157 |
|
S Tendulkar 5-322(87) |
c Sammy b Rampaul |
94 |
153 |
50 |
8.2 |
138 |
322 |
184 |
|
V Laxman 4-287 (81.1) |
c Samuels b FH Edwards |
32 |
54 |
20 |
3 |
224 |
287 |
63 |
|
V Kohli 7-428(116.2) |
c FH Edwards b Bishoo |
52 |
111 |
35 |
5 |
287 |
428 |
141 |
|
M Dhoni 6-331(91.4) |
b Sammy |
8 |
21 |
4 |
1 |
322 |
331 |
9 |
|
R Ashwin 10-482(135.4) |
c Barath b Rampaul |
103 |
118 |
45 |
15.2 |
331 |
482 |
151 |
|
I Sharma 8-455(126) |
c Bravo b Samuels |
5 |
36 |
5 |
0 |
428 |
455 |
27 |
|
V Aaron 9-463 (130) |
b Samuels |
4 |
14 |
1 |
1 |
455 |
463 |
8 |
|
P Ojha |
not out |
0 |
14 |
0 |
0 |
463 |
482 |
19 |
|
Extras 10(b1, nb 5, w 4) |
Scoring shots247 (156x1s, 27x2s, 4×3, 55x4s, 5×6) |
|||||||
|
West Indies (1st Inn) |
O |
M |
R |
W |
S.S |
4.6(SS) |
L 3 (%) |
C 3(%) |
|
F Edwards |
28 |
4 |
116 |
1 |
54 |
14.2 |
42.86 |
10.71 |
|
R Rampaul |
24.4 |
3 |
95 |
3 |
47 |
12 |
45.08 |
16.39 |
|
D Sammy |
26 |
3 |
90 |
2 |
42 |
13.1 |
50 |
26.92 |
|
M Samuels |
17 |
0 |
74 |
3 |
42 |
9 |
41.18 |
17.65 |
|
D Bishoo |
40 |
6 |
106 |
1 |
62 |
7.2 |
65 |
37.50 |
|
Byes |
|
|
1 |
|
|
|
|
|
|
Total |
135.4 |
16 |
482 |
10 |
247 |
55.5 |
50.96 |
28.80 |
|
West indies (2nd inn) 134 all out (57.2)overs |
Runs |
Balls |
S.S |
4.6(SS) |
(Begin- Score)-(End-Score) = Role play |
|||
|
A Barath 1-6(4.1) |
c Laxman b Ojha |
3 |
10 |
3 |
0 |
0 |
6 |
6 |
|
K Brathwaite 3-91 (38.5) |
c Tendulkar b Ojha |
35 |
115 |
25 |
2 |
0 |
91 |
91 |
|
K Edwards 2-30(11) |
st Dhoni b Ojha |
17 |
24 |
8 |
3 |
6 |
30 |
24 |
|
D Bravo 4-112(46.1) |
c & b Ojha |
48 |
105 |
30 |
5 |
30 |
112 |
82 |
|
K Powell 7-120(49.3) |
lbw Ashwin |
11 |
29 |
8 |
0 |
91 |
120 |
29 |
|
M Samuels 5-112(46.5) |
st Dhoni b Ojha |
0 |
4 |
0 |
0 |
112 |
112 |
0 |
|
C Baugh 6-117(47.5) |
b Ashwin |
1 |
4 |
1 |
0 |
112 |
117 |
5 |
|
D Sammy 9-134 (57.1) |
c Dhoni b Ashwin |
10 |
22 |
9 |
0 |
117 |
134 |
17 |
|
R Rampaul 8-129(52.4) |
c Tendulkar b Ojha |
0 |
14 |
0 |
0 |
120 |
129 |
9 |
|
F Edwards |
not out |
2 |
16 |
2 |
0 |
129 |
134 |
5 |
|
D Bishoo 10-134 (57.2) |
lbw Ashwin |
0 |
1 |
0 |
0 |
134 |
134 |
0 |
|
Extras 7(b3, lb 4) |
Scoring shots 86(66x1s, 9x2s, 1×3, 10x4s) |
|||||||
|
India (2nd inn) |
O |
M |
R |
W |
S.S |
4.6(SS) |
L 3 (%) |
C 3(%) |
|
P Ojha |
27 |
5 |
47 |
6 |
37 |
2 |
85.19 |
62.96 |
|
I Sharma |
8 |
2 |
15 |
0 |
9 |
2 |
75 |
37.50 |
|
V Aaron |
4 |
0 |
23 |
0 |
10 |
4 |
25 |
|
|
R Ashwin |
15.2 |
0 |
34 |
4 |
25 |
1 |
78.95 |
46.05 |
|
V Sehwag |
2 |
0 |
3 |
0 |
3 |
|
50 |
50 |
|
S Tendulkar |
1 |
0 |
5 |
0 |
2 |
1 |
|
|
|
Byes |
|
|
3 |
|
|
|
|
|
|
leg byes |
|
|
4 |
|
|
|
|
|
|
Total |
57.2 |
7 |
134 |
10 |
86 |
10.0 |
76.92 |
59.44 |
Target 243 in almost 3 sessions (64 overs)
|
India (2nd inn) 242-9 (64)overs |
Runs |
Balls |
S.S |
4.6(SS) |
Begin- Score)-(End-Score) = Role play |
|||
|
G Gambhir 1-19(4.3) |
c Sammy b FH Edwards |
12 |
11 |
8 |
1 |
0 |
19 |
19 |
|
V Sehwag 2-101(19.1) |
c Sammy b Bishoo |
60 |
65 |
34 |
8 |
0 |
101 |
101 |
|
R Dravid 4-113(24.1) |
c sub b Samuels |
33 |
49 |
28 |
1 |
19 |
113 |
94 |
|
S Tendulkar 3-106(20.5) |
c KA Edwards b Samuels |
3 |
7 |
3 |
0 |
101 |
106 |
5 |
|
V Laxman 5-165(39.3) |
c Barath b Rampaul |
31 |
53 |
24 |
1 |
106 |
165 |
59 |
|
V Kohli 7-224(59.1) |
c Sammy b Bishoo |
63 |
114 |
44 |
3.1 |
113 |
224 |
111 |
|
M Dhoni 6-189(49.4) |
c KA Edwards b Rampaul |
13 |
37 |
8 |
1 |
165 |
189 |
24 |
|
R Ashwin 9-242(64) |
run out |
14 |
27 |
13 |
0 |
189 |
242 |
53 |
|
I Sharma 8-239(62.5) |
b Rampaul |
10 |
17 |
6 |
1 |
224 |
239 |
15 |
|
V Aaron |
not out |
2 |
5 |
2 |
0 |
239 |
242 |
3 |
|
P Ojha Did not bat |
||||||||
|
Extras 1(nb) |
Scoring shots 170 (136x1s, 16x2s, 1×3, 16x4s, 1×6) |
|||||||
|
West Indies (2nd Inn) |
O |
M |
R |
W |
S.S |
4.6(SS) |
L 3 (%) |
C 3(%) |
|
F Edwards |
7 |
0 |
28 |
1 |
20 |
2 |
42.86 |
|
|
R Rampaul |
16 |
1 |
56 |
3 |
38 |
5 |
75 |
50 |
|
M Samuels |
25 |
0 |
93 |
2 |
70 |
3.1 |
52 |
28 |
|
D Bishoo |
16 |
0 |
65 |
2 |
42 |
6 |
50 |
31.50 |
|
run out |
|
|
|
1 |
|
|
|
|
|
Total |
64 |
1 |
242 |
9 |
170 |
16.1 |
56.25 |
34.38 |
Explanation of indices used in this scorecard
One should always consider team records and milestones more important and valuable than individual records and milestones, as it shows teams progress(set of players) over a period of time, compared to one individual player’s progress.
Here not suggesting that individual player, either a bowler, or a batsman, or even a fielder should not be looking at his personal milestones, neverthless he should be looking from team’s perspective.
However, shockingly this one record went unnoticed. It so happened that Darren Bravo’s century at Eden Gardens(2nd Test, v India, Nov ) was the 100th Test century for West Indies against India in Test history. Although they lost that game and subsequently the series, it posed a question on their progression since they lost Test dominance.
-List of centuries scored by West Indies against each country in Test history.
|
For West Indies |
Tests |
Centuries |
Total wins |
|
v England |
145 |
128 |
53 |
|
v Australia |
108 |
102 |
32 |
|
v India* |
88 |
101* |
30 |
|
v Pakistan |
46 |
31 |
15 |
|
v South Africa |
25 |
22 |
3 |
|
v New Zealand |
37 |
37 |
10 |
|
v Sri Lanka |
15 |
8 |
3 |
|
v Zimbabwe |
6 |
4 |
4 |
|
v Bangladesh |
8 |
7 |
4 |
|
Total |
478 |
440 |
154 |
Above table should aspire West Indies batsmen to do well, for the reason that, apart from them, only England & Australia have scored 100 tons against different countries!! .
Decade wise capsule for West Indies Test history.
|
Period |
Tests |
Centuries |
Total wins |
|
1928-1949 |
31 |
30 |
7 |
|
1950-1960 |
55 |
65 |
18 |
|
1961-1970 |
42 |
43 |
18 |
|
1971-1980 |
76 |
78 |
21 |
|
1981-1990 |
76 |
71 |
43 |
|
1991-2000 |
88 |
53 |
31 |
|
2001-2011 |
110 |
100 |
16 |
|
|
478 |
440 |
154 |
Above capsule shows West Indies Test supremacy in various decades, and as they lost their dominance, they seem to be playing more Test matches (last 2 decades)… yet, consistent-success eludes them now!.
Centuries scored by other countries in Test history.
|
Teams |
Tests |
Centuries |
Total wins |
|
England |
915 |
788 |
326 |
|
Australia |
735 |
745 |
343 |
|
West Indies* |
478 |
440 |
154 |
|
India* |
458 |
412 |
112 |
|
Pakistan |
362 |
319 |
110 |
|
South Africa |
360 |
302 |
126 |
|
New Zealand |
365 |
224 |
69 |
|
Sri Lanka |
207 |
193 |
61 |
|
Zimbabwe |
86 |
46 |
9 |
|
Bangladesh |
71 |
22 |
3 |
Ideally a Test team should have at least one centurion in every Test match (2 inns). Australia is far the best Test side, averaging a century in every game, followed closely by Sri Lanka.
A look at India’s list of centuries against various countries in Test history.
|
For India |
Tests |
Centuries |
Total wins |
|
v England |
103 |
81 |
19 |
|
v Australia |
78 |
62 |
20 |
|
v West Indies* |
88 |
76 |
14 |
|
v Pakistan |
59 |
51 |
9 |
|
v South Africa |
27 |
23 |
7 |
|
v New Zealand |
50 |
45 |
16 |
|
v Sri Lanka |
35 |
47 |
14 |
|
v Zimbabwe |
11 |
14 |
7 |
|
v Bangladesh |
7 |
13 |
6 |
|
Total |
458 |
412 |
112 |
Lately Indian batsmen have done exceedingly well against a better bowling attack, as they notched up more than 10 centuries, each against South Africa(2008-2010 ) and Pakistan (2006 & 2007)in their last two series.
All data processed at end of West Indies(1st inn) vs India 3rd Test, Mumbai, Nov 21, 2011.
In just concluded 2-Test series, both teams scored same amount of runs (937) in almost same number of overs, with home team having an upper hand in all areas, neverthless it was Australia who fought back inspite humiliation and injury, as they restored honor of not losing a series in South Africa for 41years & winning one of the greatest chase in recent times.
Australia Batting
Australia: Although most Australians were out of form, yet their contribution as batsmen was worth noting. Their captain Clarke scored the only century of the series, which happened to be his best so far.
All Aussies were involved in 50+ partnerships, adding to this each batsmen gave Australia 100run(Player’s Role) contribution while at crease.
|
Batsmen |
Ins |
Runs |
H.S |
100s |
50s |
Balls |
S.S |
4.6(SS) |
*Role- play |
50+ |
100+ |
|
M Clarke |
4 |
166 |
151 |
1 |
0 |
231 |
80 |
24 |
271 |
1 |
1 |
|
P Hughes |
4 |
117 |
88 |
0 |
1 |
162 |
47 |
18 |
219 |
|
1 |
|
M Johnson |
4 |
101 |
40* |
|
|
130 |
47 |
14 |
203 |
1 |
|
|
S Watson |
4 |
95 |
88 |
0 |
1 |
160 |
37 |
15.2 |
205 |
|
1 |
|
U Khawaja |
2 |
77 |
65 |
|
1 |
167 |
41 |
9.1 |
195 |
|
1 |
|
S Marsh |
2 |
44 |
44 |
|
|
103 |
17 |
8 |
134 |
|
1 |
|
B Haddin |
4 |
76 |
55 |
|
1 |
140 |
35 |
11 |
159 |
2 |
|
|
R Ponting |
4 |
70 |
62 |
|
1 |
178 |
39 |
6.1 |
181 |
|
1 |
|
M Hussey |
4 |
60 |
39 |
|
|
123 |
32 |
7.0 |
106 |
1 |
|
Australia Bowling
As the tour progressed their bowling attack became imbalance, with injuries to Ryan Harris & Watson, and Johnson fast declining, it was difficult for the tourist to get a right combination. Australia regressed back to bowling much shorter and wider, not allowing their skills to have any effect. In the end it was fragile mid & lower batting from South Africa which gave Aussies a chance to chase….a defendable total!!.
|
Bowlers |
Inns |
O |
M |
R |
W |
Best |
4wi |
5wi |
S.S |
4.6(SS) |
C 3 |
L 3 |
< 10 |
L B W |
Bowled |
|
P Cummins |
2 |
44 |
8 |
117 |
7 |
6-79 |
1 |
40 |
13 |
16 |
28 |
2 |
1 |
||
|
S Watson |
3 |
18.5 |
3 |
74 |
6 |
5-17 |
1 |
26 |
14 |
5 |
10 |
4 |
3 |
1 |
|
|
R Harris |
2 |
24.3 |
5 |
100 |
4 |
4-33 |
1 |
42 |
14 |
4 |
10 |
3 |
1 |
2 |
|
|
N Lyon |
3 |
32 |
7 |
120 |
4 |
2-52 |
49 |
12.3 |
8 |
16 |
1 |
1 |
|||
|
P Siddle |
4 |
58.2 |
15 |
205 |
4 |
3-69 |
65 |
28.1 |
15 |
31 |
1 |
||||
|
M Johnson |
4 |
62.1 |
9 |
255 |
3 |
1-61 |
100 |
37 |
10 |
28 |
0 |
0 |
0 |
South Africa Batting: South Africa went into this series, with their captain Smith completely out of form, yet his resilient batting along with excellent support by his deputy Amla paved South Africa a strong base, and allowed them a historic win. The middle order performed poorly, especially Kallis.
|
South Africa |
Ins |
Runs |
H.S |
100s |
50s |
Balls |
S.S |
4.6(SS) |
*Role- play |
50+ |
100+ |
|
H Amla |
4 |
239 |
112 |
2 |
0 |
463 |
111 |
38 |
545 |
1 |
2 |
|
G Smith |
4 |
185 |
101* |
1 |
0 |
261 |
81 |
26 |
408 |
1 |
|
|
A de Villiers |
3 |
145 |
73 |
0 |
2 |
242 |
66 |
23.1 |
295 |
2 |
|
|
J Rudolph |
4 |
86 |
30 |
0 |
0 |
126 |
34 |
13 |
134 |
1 |
|
|
J Kallis |
4 |
58 |
54 |
0 |
1 |
70 |
20 |
8.2 |
109 |
||
|
A Prince |
3 |
52 |
50 |
0 |
1 |
108 |
21 |
9 |
124 |
1 |
South Africa Bowling: Arguably the best bowling attack in world cricket. With Steyn as their spearhead, they found a great support in Vernon Phillander(debutant) whose accuracy and movement reminds one of Fannie De Villers, yet Philander gets more bounce and pace.
They are ably supported by Morkel, who bowls well to left handers. Their accuracy was projected by the number of ‘straight ball dismissals’ = L B W (11), which had 10 top batsmen, all getting out for low scores (< 10).
|
Bowlers |
Inns |
O |
M |
R |
W |
Best |
4wi |
5wi |
S.S |
4.6(SS) |
C 3 |
L 3 |
< 10 |
L B W |
Bowled |
|
V Philander |
4 |
63 |
13 |
195 |
14 |
5-15 |
2 |
77 |
22.1 |
21 |
37 |
4 |
2 |
||
|
D Steyn |
4 |
66 |
9 |
240 |
11 |
4-55 |
2 |
0 |
95 |
24.2 |
22 |
37 |
7 |
5 |
1 |
|
M Morkel |
4 |
60 |
13 |
196 |
8 |
3-9 |
0 |
74 |
28 |
7 |
31 |
4 |
0 |
1 |
|
|
I Tahir |
3 |
39.3 |
3 |
153 |
4 |
3-55 |
0 |
69 |
13.1 |
5 |
20 |
2 |
2 |
1 |
|
|
J Kallis |
3 |
28 |
3 |
121 |
1 |
1-56 |
0 |
48 |
18 |
3 |
10 |
0 |
0 |
0 |
Explanation of primary indices used in these tables
Explanation of secondary indices
A – < 10: Low score dismissals (Bowler’s table).
B – L B W (Bowler’s table) : No. of L B W dismissals for bowlers
C – BOWLED (Bowler’s table) : No. of Bowled dismissals for bowlers.
D – Role-play : Batsmen’s (Begin Score)- (End score) = Role-Play
Australia in South Africa, Nov 2011. Series level 1-1.
|
South Africa 1st Inns 266 all out (71)overs |
Runs |
Balls |
S.S |
4.6(SS) |
(Begin- Score)-(End-Score) = Role play |
|||
|
J Rudolph 2-43(14.4) |
c Haddin b Watson |
30 |
50 |
13 |
4 |
0 |
43 |
43 |
|
G Smith 1-24(6.4) |
c Clarke b Johnson |
11 |
18 |
4 |
2 |
0 |
24 |
24 |
|
H Amla 4-129(31.1) |
c Ponting b Cummins |
19 |
70 |
9 |
3 |
24 |
129 |
105 |
|
J Kallis 3-123(28.5) |
c Khawaja b Siddle |
54 |
41 |
17 |
8 |
43 |
123 |
80 |
|
de Villiers 6-243(60.5) |
c Cummins b Siddle |
64 |
97 |
29 |
11.2 |
123 |
243 |
120 |
|
A Prince 5-241 (60) |
c Johnson b Lyon |
50 |
89 |
19 |
9 |
129 |
241 |
112 |
|
M Boucher 8-245(62.5) |
c Lyon b Siddle |
3 |
7 |
2 |
0 |
241 |
245 |
4 |
|
V Philander7-243(61.5) |
lbw Lyon |
0 |
5 |
0 |
0 |
243 |
243 |
0 |
|
D Steyn |
not out |
15 |
31 |
7 |
1.1 |
243 |
266 |
23 |
|
M Morkel 9-258(68.2) |
c Watson b Clarke |
6 |
14 |
3 |
1 |
245 |
258 |
13 |
|
I Tahir 10-266(71) |
c Hughes b Clarke |
0 |
5 |
0 |
0 |
258 |
266 |
8 |
|
Extras 14(b 9, lb 2, nb1, w2) |
Scoring shots103 (45x1s, 15x2s, 1×3, 39x4s, 3x6s) |
|||||||
|
Australia 1st Inn |
O |
M |
R |
W |
S.S |
4.6(SS) |
L 3(%) |
C 3 (%) |
|
M Johnson |
16.1 |
4 |
67 |
1 |
29 |
10 |
49.69 |
12.42 |
|
P Cummins |
15 |
3 |
38 |
1 |
15 |
7 |
53.33 |
26.67 |
|
P Siddle |
15 |
4 |
69 |
3 |
22 |
13.1 |
53.33 |
33.33 |
|
S Watson |
3.5 |
1 |
13 |
1 |
4 |
3 |
57.14 |
0.00 |
|
N Lyon |
13 |
2 |
52 |
2 |
24 |
5.2 |
53.85 |
38.46 |
|
M Hussey |
4 |
0 |
10 |
0 |
6 |
|
75.00 |
75.00 |
|
M Clarke |
4 |
1 |
6 |
2 |
3 |
1 |
75.00 |
25.00 |
|
Byes |
|
|
9 |
|
|
|
|
|
|
Leg byes |
|
|
2 |
|
|
|
|
|
|
Total |
71 |
15 |
266 |
10 |
103 |
39.3 |
55.24 |
29.75 |
|
Australia 1st inns 296 all out(76.4)overs |
Runs |
Balls |
S.S |
4.6(SS) |
(Begin- Score)-(End-Score) = Role play |
|||
|
S Watson 2-192(45.4) |
c Tahir b Kallis |
88 |
140 |
35 |
14 |
0 |
192 |
192 |
|
P Hughes 1-174(36.3) |
c de Villiers b Philander |
88 |
111 |
36 |
14 |
0 |
174 |
174 |
|
U Khawaja 5-228(59.4) |
lbw Steyn |
12 |
57 |
9 |
1 |
174 |
228 |
54 |
|
R Ponting 3-193(46.3) |
lbw Steyn |
0 |
3 |
0 |
0 |
192 |
193 |
1 |
|
M Clarke 4-212(54.3) |
c de Villiers b Morkel |
11 |
33 |
5 |
2 |
193 |
212 |
19 |
|
M Hussey 6-233(62) |
b Steyn |
20 |
27 |
7 |
4 |
212 |
233 |
21 |
|
B Haddin 7-255(68.1) |
lbw Tahir |
16 |
23 |
6 |
3 |
228 |
255 |
27 |
|
M Johnson |
not out |
38 |
49 |
17 |
6 |
233 |
296 |
63 |
|
P Siddle 8-255(68.5) |
b Tahir |
0 |
4 |
0 |
0 |
255 |
255 |
0 |
|
P Cummins 9-285(73.4) |
c Boucher b Steyn |
2 |
7 |
2 |
0 |
255 |
285 |
30 |
|
Lyons 10-296(76.4) |
lbw Tahir |
2 |
10 |
2 |
0 |
285 |
296 |
11 |
|
Extras 19(b4, lb8, nb 4, w3) |
Scoring shots119(59x1s, 12x2s, 2x3s, 44x4s, 2x6s) |
|||||||
|
South Africa 1st Inn |
O |
M |
R |
W |
S.S |
4.6(SS) |
L 3(%) |
C 3(%) |
|
D Steyn |
18 |
3 |
64 |
4 |
24 |
9.1 |
61.11 |
38.89 |
|
V Philander |
15 |
4 |
47 |
1 |
21 |
6 |
53.33 |
20.00 |
|
M Morkel |
17 |
4 |
62 |
1 |
22 |
11 |
41.18 |
5.88 |
|
J Kallis |
13 |
2 |
56 |
1 |
18 |
9 |
38.46 |
15.38 |
|
I Tahir |
13.4 |
2 |
55 |
3 |
21 |
6.1 |
44.78 |
7.46 |
|
Byes |
|
|
4 |
|
|
|
|
|
|
Leg byes |
|
|
8 |
|
|
|
|
|
|
Total |
76.4 |
15 |
296 |
10 |
199 |
44.2 |
48.43 |
27.49 |
|
South Africa 2nd Inn 339 all out 110 overs |
Runs |
Balls |
S.S |
4.6(SS) |
(Begin- Score)-(End-Score) = Role play |
|||
|
G Smith 2-75(20) |
c Hughes b Lyon |
36 |
55 |
16 |
6 |
0 |
75 |
75 |
|
J Rudolph 1-40(7.2) |
c Haddin b Cummins |
24 |
23 |
8 |
5 |
0 |
40 |
40 |
|
H Amla 6-260(84.1) |
c Haddin b Johnson |
105 |
243 |
58 |
14 |
40 |
260 |
260 |
|
J Kallis 3-90(27.2) |
c Clarke b Cummins |
2 |
19 |
2 |
0 |
75 |
90 |
90 |
|
de Villiers 4-237(73.1) |
c Clarke b Cummins |
73 |
136 |
35 |
10.1 |
90 |
237 |
237 |
|
A Prince 5-249(79) |
run out |
2 |
18 |
2 |
0 |
237 |
249 |
249 |
|
M Boucher 7-266(87.2) |
c Watson b Lyon |
13 |
20 |
4 |
3 |
249 |
266 |
266 |
|
V Philander 8-314(105.1) |
c Haddin b Cummins |
23 |
72 |
14 |
3 |
260 |
314 |
314 |
|
D Steyn 10-339(110) |
c Haddin b Cummins |
41 |
64 |
15 |
2.3 |
266 |
339 |
339 |
|
M Morkel 9-314(105.2) |
b Cummins |
0 |
1 |
0 |
0 |
314 |
314 |
314 |
|
I Tahir |
not out |
4 |
11 |
1 |
1 |
314 |
339 |
339 |
|
Extras 16(b5, lb 2, nb2, w7) |
Scoring shots 155(92x1s,14x2s,1×3, 44x4s,4x6s) |
|||||||
|
Australia 2nd inn |
O |
M |
R |
W |
S.S |
4.6(SS) |
L 3 (%) |
C 3 (%) |
|
M Johnson |
30 |
4 |
101 |
1 |
35 |
14 |
53.33 |
26.67 |
|
P Cummins |
29 |
5 |
79 |
6 |
25 |
6 |
68.97 |
41.38 |
|
P Siddle |
27 |
10 |
71 |
0 |
15 |
8 |
55.56 |
22.22 |
|
N Lyon |
16 |
4 |
57 |
2 |
21 |
5.1 |
50.00 |
18.75 |
|
M Hussey |
5 |
0 |
14 |
0 |
7 |
|
60.00 |
0.00 |
|
M Clarke |
2 |
1 |
2 |
0 |
2 |
|
100.00 |
0.00 |
|
R Ponting |
1 |
0 |
8 |
0 |
3 |
1 |
0.00 |
0.00 |
|
Byes |
|
|
5 |
|
|
|
|
|
|
leg byes |
|
|
2 |
|
|
|
|
|
|
run out |
|
|
|
1 |
|
|
|
|
|
Total |
110 |
24 |
339 |
10 |
155 |
44.4 |
58.18 |
30.00 |
Target: 310 Runs to win in 4 ½ sessions, approx (127) overs.
|
Australia 2ND inns 310-8 of (86.5) overs |
Runs |
Balls |
S.S |
4.6(SS) |
(Begin- Score)-(End-Score) = Role play |
||||
|
S Watson 1-0(0.2) |
b Philander |
0 |
2 |
0 |
0 |
0 |
0 |
0 |
|
|
PJ Hughes 2-19(2.5) |
c Kallis b Philander |
11 |
10 |
3 |
2 |
0 |
19 |
19 |
|
|
U Khawaja 3-141(36.5) |
c Kallis b Tahir |
65 |
110 |
32 |
8.1 |
0 |
141 |
141 |
|
|
R Ponting 5-165(50.1) |
c Rudolph b Morkel |
62 |
138 |
37 |
6 |
19 |
165 |
146 |
|
|
M Clarke 4-145(40.4) |
b Philander |
2 |
16 |
2 |
0 |
141 |
145 |
4 |
|
|
M Hussey 6-215(69.1) |
lbw Philander |
39 |
77 |
24 |
3 |
145 |
215 |
70 |
|
|
B Haddin 7-287(82.2) |
c Boucher b Philander |
55 |
106 |
27 |
7 |
165 |
287 |
122 |
|
|
M Johnson |
not out |
40 |
47 |
20 |
6 |
215 |
310 |
95 |
|
|
P Siddle 8-292(83.4) |
c Tahir b Steyn |
4 |
7 |
1 |
1 |
287 |
292 |
5 |
|
|
P Cummins |
not out |
13 |
15 |
5 |
2 |
292 |
310 |
18 |
|
|
N Lyon: did not bat |
|||||||||
|
Extras 19(b1, lb7, nb7, w4) |
Scoring shots150(92x 1s, 18x2s, 4x3s, 35x4s, 1×5, 1×6) |
||||||||
|
South Africa 2nd Inn |
O |
M |
R |
W |
S.S |
4.6(SS) |
L 3 (%) |
C 3(%) |
|
V Philander |
20 |
3 |
70 |
5 |
23 |
7 |
50.00 |
25.00 |
|
D Steyn |
23 |
1 |
98 |
1 |
34 |
7.1 |
43.48 |
21.74 |
|
M Morkel |
19 |
6 |
43 |
1 |
12 |
4 |
63.16 |
0.00 |
|
I Tahir |
15.5 |
0 |
63 |
1 |
27 |
3 |
51.61 |
12.90 |
|
J Kallis |
9 |
1 |
28 |
0 |
18 |
2 |
55.56 |
11.11 |
|
Byes |
|
|
1 |
|
|
|
|
|
|
leg byes |
|
|
7 |
|
|
|
|
|
|
Total |
86.5 |
11 |
310 |
8 |
150 |
36.1 |
52.02 |
27.75 |
Explanation of indices used in this scorecard
Some statistical anecdotes :
1- * Australia managed to keep their honor of not losing a Test series in South Africa for 41years. Only twice they lost in South Africa(1966 &1970) and since then, in 6series, they won 4 and leveled 2.
2- *In last 4years, only four times Aussies won a game without any of their batsmen scoring a century, and in this period, they played 48Tests & won 23.
3- *Pat Cummins made his Test debut, he became 423rd Aussie to wear the Baggy Green. In last 4years there have been 24 debutants for the Australians.
4- *This year itself (2011)Test cricket has inducted 41 debutants in 31Test matches(inclusive 3rd Test West Indies v India).
West Indies in India – 2011
2nd Test, Nov(14-18)2011, Kolkata, India won by an inn and 15 Runs.
|
India 1st Inn 631 -7decl(151.2)overs |
Runs |
Balls |
S.S |
4.6s |
||||
|
G Gambhir 2-149(34.2) |
c Barath b FH Edwards |
65 |
103 |
36 |
8 |
0 |
149 |
149 |
|
V Sehwag 1-66(12.1) |
c Barath b Sammy |
38 |
33 |
14 |
8 |
0 |
66 |
66 |
|
R Dravid 4-345(87) |
b Brathwaite |
119 |
207 |
79 |
9.2 |
66 |
345 |
279 |
|
S Tendulkar 3-205(52) |
c Samuels b Bishoo |
38 |
71 |
20 |
5 |
149 |
205 |
56 |
|
V Laxman |
not out |
176 |
280 |
127 |
12 |
205 |
631 |
426 |
|
I Sharma 5-346(87.3) |
c †Baugh b Roach |
0 |
1 |
0 |
0 |
345 |
346 |
1 |
|
Yuvraj 6-396(97.5) |
lbw b Sammy |
25 |
35 |
8 |
5 |
346 |
396 |
50 |
|
M Dhoni 7-620(148.3) |
c †Baugh b Roach |
144 |
175 |
85 |
10.5 |
396 |
620 |
224 |
|
R Ashwin |
not out |
4 |
12 |
4 |
|
620 |
631 |
11 |
|
P Ojha & U Yadav did not bat |
|
|
|
|
|
|
|
|
|
Extras 22(b6, lb5, nb9, w2) |
Scoring shots 373(280 x 1s, 28 x 2s, 1 x3s, 57x4s, 7 x6s) |
|||||||
|
West Indies 1st Inn |
O |
M |
R |
W |
S.S |
4.6s |
L 3(%) |
C 3(%) |
|
FH Edwards |
22.2 |
1 |
81 |
1 |
41 |
12 |
45.05 |
18.02 |
|
DJG Sammy |
25 |
0 |
132 |
2 |
66 |
19.1 |
36.00 |
20.00 |
|
KAJ Roach |
26 |
1 |
106 |
2 |
57 |
10.1 |
42.31 |
19.23 |
|
MN Samuels |
27 |
0 |
104 |
0 |
71 |
5.2 |
55.56 |
22.22 |
|
Bishoo |
45 |
2 |
154 |
1 |
117 |
8.1 |
51.11 |
31.11 |
|
KC Brathwaite |
6 |
0 |
43 |
1 |
21 |
3.2 |
|
00.00 |
|
byes |
|
|
6 |
|
0 |
|
|
|
|
leg byes |
|
|
5 |
|
0 |
|
|
|
|
run out |
|
|
0 |
|
0 |
|
|
|
|
total |
151 |
4 |
631 |
7 |
373 |
57.7 |
|
|
|
West Indies 1st inn 153 all out(48) overs |
Runs |
Balls |
S.S |
4.6s |
||||
|
A Barath 1-3(1.2) |
c Sehwag b Yadav |
1 |
4 |
1 |
0 |
0 |
3 |
3 |
|
K Brathwaite 2-30(11.1) |
c Gambhir b Ashwin |
17 |
31 |
9 |
2 |
0 |
30 |
30 |
|
K Edwards 3-42(16.3) |
lbw b Ojha |
16 |
47 |
8 |
2 |
3 |
42 |
39 |
|
D Bravo 5-92(31.1) |
b Yadav |
30 |
56 |
11 |
6 |
30 |
92 |
62 |
|
S Chanderpaul 4-46(18.3) |
lbw b Ashwin |
4 |
6 |
1 |
1 |
42 |
46 |
4 |
|
M Samuels 6-99(33.4) |
b Yadav |
25 |
51 |
14 |
3 |
46 |
99 |
53 |
|
C Baugh 9-129(40.4) |
lbw b Ojha |
13 |
27 |
8 |
1 |
92 |
129 |
37 |
|
D Sammy 7-120(37) |
c †Dhoni b Ojha |
18 |
14 |
6 |
2.1 |
99 |
120 |
21 |
|
K Roach 8-129(40.3) |
run out (Ojha) |
2 |
8 |
1 |
0 |
120 |
129 |
9 |
|
F Edwards 10-153(48) |
lbw b Ojha |
16 |
16 |
7 |
3 |
129 |
153 |
24 |
|
D Bishoo |
not out |
8 |
28 |
5 |
1 |
129 |
153 |
24 |
|
Extras 3(lb 3) |
Scoring shots 71 (38x1s, 11 x2s, 21x4s, 1x6s) |
|||||||
|
India 1st Inn |
O |
M |
R |
W |
S.S |
4.6 |
L 3(%) |
C 3 (%) |
|
PP Ojha |
22 |
5 |
64 |
4 |
32 |
8.1 |
59.09 |
31.82 |
|
U Yadav |
7 |
1 |
23 |
3 |
9 |
4 |
|
00.00 |
|
R Ashwin |
14 |
3 |
49 |
2 |
22 |
8 |
50.00 |
21.43 |
|
I Sharma |
5 |
2 |
14 |
0 |
8 |
1 |
|
|
|
byes |
|
|
0 |
|
0 |
|
|
|
|
leg byes |
|
|
3 |
|
0 |
|
|
|
|
run out |
|
|
0 |
1 |
0 |
|
|
|
|
total |
48 |
11 |
153 |
10 |
71 |
21.1 |
|
|
|
West Indies 2nd Inn (followed on) 463 all out (126.3) overs |
Runs |
Balls |
S.S |
4.6s |
||||
|
A Barath 2-116(32.4) |
c Laxman b Sharma |
62 |
105 |
31 |
10 |
0 |
116 |
116 |
|
K Brathwaite 1-23(4.2) |
c †Dhoni b Yadav |
9 |
15 |
5 |
1 |
0 |
23 |
23 |
|
K Edwards 3-161(50.1) |
lbw b Sharma |
60 |
128 |
34 |
6.1 |
23 |
161 |
138 |
|
D Bravo 5-401(110.1) |
c Dravid b Ojha |
136 |
230 |
65 |
16.4 |
116 |
401 |
285 |
|
S Chanderpaul 4-269(83.5) |
b Yadav |
47 |
94 |
26 |
6 |
161 |
269 |
108 |
|
M Samuels 7-417(117.5) |
lbw b Ashwin |
84 |
111 |
35 |
13.1 |
269 |
417 |
148 |
|
C Baugh 6-411(116.1) |
c Dravid b Ojha |
3 |
19 |
3 |
0 |
401 |
411 |
10 |
|
D Sammy 9-463(126.2) |
b Yadav |
32 |
28 |
13 |
1.3 |
411 |
463 |
52 |
|
K Roach 8-421(121.4) |
b Ashwin |
1 |
13 |
1 |
0 |
417 |
421 |
4 |
|
F Edwards |
not out |
15 |
15 |
5 |
3 |
421 |
463 |
42 |
|
D Bishoo 10-463(126.3) |
b Yadav |
0 |
1 |
0 |
0 |
463 |
463 |
0 |
|
Extras 14(b 9, lb 4, W1) |
Scoring shots 218 (136x 1s, 16x2s, 1x3s, 56x4s, 9x6s) |
|||||||
|
India 2ND Inn |
O |
M |
R |
W |
S.S |
4.6 |
L 3(%) |
C 3(%) |
|
U Yadav |
17.3 |
1 |
80 |
4 |
33 |
15 |
|
|
|
I Sharma |
25 |
4 |
95 |
2 |
41 |
17 |
|
|
|
PP Ojha |
32 |
5 |
104 |
2 |
51 |
12.3 |
|
|
|
R Ashwin |
40 |
4 |
137 |
2 |
75 |
9.5 |
57.50 |
|
|
Yuvraj |
3 |
0 |
14 |
0 |
8 |
2 |
|
|
|
V Sehwag |
9 |
2 |
20 |
0 |
10 |
1.1 |
|
44.44 |
|
Byes |
|
|
9 |
|
|
|
|
|
|
leg byes |
|
|
4 |
|
|
|
|
|
|
run out |
|
|
0 |
|
|
|
|
|
|
Total |
126 |
16 |
463 |
10 |
218 |
56.9 |
|
|
West Indies: Tests 9, Won 2. India: Tests 10, Won 3
1- –So far both West Indies & India have played maximum Tests.
2- –For the first time this year, both (WI & Ind) scored > 400 score in a Test Inn.
3- –West Indies batsmen were victims of most L B W dismissals this year. In 9 Tests(18 Inns)39 batsmen were L B W, which is 23.78 % of their total wickets.
4- –Interestingly for India, there was not a single 100+ partnerships for the first and second wicket this year.
5- –16centuries were scored against the India bowling, & surprisingly only 6 against the West Indies bowling attack!.
E Explanation of indices used in this scorecard.
* ( Begin-score)- (End -score) = Role Play
First time in 16 years India failed to score big in a season.
Although there are still 3Test matches to be played before this year ends, neverthless it’s the first time since 1995 that India have failed to score big in a Test match. A score of 400 is considered a big total, its not only a winning total, but sufficient enough for teams not to lose a game.
So far this year(2011) India have played 9Tests, and not a single time they scored 400 or more in a Test match. Their poor batting across the line-up reflects lack of runs, and perhaps this is one of the reason why they have lost 4games and won only 2 this year.
Here is a list.
|
India |
Tests |
Won |
Lost |
400+score |
|
1995 |
3 |
1 |
0 |
0 |
|
1996 |
8 |
3 |
3 |
3 |
|
1997 |
12 |
0 |
2 |
6 |
|
1998 |
5 |
2 |
3 |
3 |
|
1999 |
10 |
2 |
4 |
4 |
|
2000 |
6 |
2 |
3 |
3 |
|
2001 |
13 |
5 |
5 |
3 |
|
2002 |
16 |
6 |
5 |
7 |
|
2003 |
5 |
1 |
1 |
4 |
|
2004 |
12 |
6 |
3 |
7 |
|
2005 |
8 |
5 |
1 |
5 |
|
2006 |
12 |
3 |
3 |
4 |
|
2007 |
10 |
3 |
2 |
6 |
|
2008 |
15 |
6 |
4 |
7 |
|
2009 |
6 |
3 |
0 |
7 |
|
2010 |
14 |
8 |
3 |
11 |
|
2011 |
9 |
1 |
4 |
0 |
|
164 |
57 |
46 |
80 |
Indian 2011:
Only Rahul Dravid and Sachin Tendulkar manage to score centuries, yet from those 5centuries only once India won a Test match. It’s their openers who failed to score big and put on substantial partnerships, which has caused India all the problem of scoring big totals. Both Sehwag and Gambhir have been under-performing.
Top performers
|
Batsmen |
Tests |
Runs |
Avg |
100s |
50s |
Partnerships 100+ |
|
R Dravid |
9 |
833 |
55.5 |
4 |
2 |
1 |
|
V Laxman |
9 |
531 |
35.4 |
0 |
6 |
1 |
|
S Tendulkar |
6 |
516 |
46.9 |
1 |
3 |
2 |
|
S Raina |
7 |
337 |
25.9 |
0 |
4 |
3 |
|
G Gambhir |
5 |
322 |
32.2 |
0 |
2 |
|
|
M Dhoni |
9 |
317 |
22.6 |
0 |
3 |
1 |
|
V Sehwag |
4 |
175 |
21.9 |
0 |
2 |
|
|
Bowlers |
Tests |
Overs |
Runs |
Wkts |
Avg |
R/O |
|
I Sharma |
9 |
381.2 |
1279 |
38 |
33.65 |
3.35 |
|
P Kumar |
6 |
268.3 |
697 |
27 |
25.81 |
2.59 |
|
Harbhajan |
6 |
259.4 |
761 |
20 |
38.05 |
2.93 |
|
S Sreesanth |
4 |
164 |
686 |
13 |
52.76 |
4.18 |
|
R Ashwin |
1 |
48.3 |
128 |
9 |
14.22 |
2.63 |
|
P Ojha |
1 |
48.2 |
109 |
7 |
15.57 |
2.25 |
|
A Mishra |
3 |
107.5 |
433 |
7 |
61.85 |
4.01 |
|
Z Khan |
2 |
63.2 |
171 |
6 |
28.5 |
2.7 |
So far in Test history(2016Tests), 1108times teams have scored 400+ in 1st innings(first & second batting),which in simpler words means every second game there are teams scoring 400 or more in their first innings.
|
Teams |
Tests |
1ST bat(400+) |
2nd bat(400+) |
Total |
|
Australia |
734 |
139 |
105 |
244 |
|
England |
915 |
137 |
104 |
241 |
|
India |
456 |
69 |
72 |
141 |
|
West Indies |
476 |
65 |
72 |
137 |
|
Pakistan |
362 |
45 |
52 |
97 |
|
South Africa |
359 |
49 |
43 |
92 |
|
New Zealand |
365 |
33 |
35 |
68 |
|
Sri Lanka |
207 |
25 |
29 |
54 |
|
Zimbabwe |
86 |
9 |
3 |
12 |
|
Bangladesh |
71 |
5 |
1 |
6 |
India have a wonderful opportunity to score big in second Test at Kolkata, since 2000 1st Inn avg score at Eden Gardens is 416runs, & it gets better if they bat second (428) in first innings.
But having stated all this, will India bat first if they win the toss or field first ? because not only India, but most teams have opted to field first after winning the toss, and average score for teams is much higher(374) than for teams that bat first (320). It is very obvious that they have more faith in their their opening bowlers than their top order batsmen!.
Toss factor in 2011.
In 28 Tests, on 14occasion teams have opted to field first, yet they could muster only win compare to 7for teams that bat first after winning the toss.
A look at Test batting partnerships in 2011(inclusive both innings) 28 Tests
|
Wkt-partnership |
All nations |
100+ |
India |
100+ |
|
I |
50.95 |
4 |
22.53 |
|
|
II |
38.96 |
5 |
37.40 |
|
|
III |
51.21 |
13 |
33.33 |
1 |
|
IV |
41.60 |
12 |
31.10 |
1 |
|
V |
32.80 |
7 |
30.90 |
2 |
|
VI |
34.20 |
6 |
13.60 |
1 |
|
VII |
24.20 |
4 |
25.60 |
1 |
|
VIII |
16.00 |
1 |
22 |
0 |
|
IX |
12.08 |
0 |
13.13 |
0 |
|
X |
6.72 |
|
5.26 |
|
|
28Tests |
33.08 |
52 |
28.46 |
6 |
All data processed at the end of 2016 Tests
Australia in South Africa 2011
1st Test , Nov 9-13, 2011, Cape Town. South Africa won by 8wkts.
|
Australia 1st Inn 284 all out (75) Overs |
Runs |
Balls |
SS |
4.6s |
Begin-score |
End-score |
|
|
S Watson 1-9(4.3) |
c Kallis b Steyn |
3 |
15 |
1 |
0 |
0 |
9 |
|
P Hughes 2-13(6) |
c Boucher b Philander |
9 |
19 |
5 |
1 |
0 |
13 |
|
S Marsh 4-143(39.1) |
lbw Steyn |
44 |
101 |
17 |
8 |
9 |
143 |
|
R Ponting 3-40(16.2) |
lbw Steyn |
8 |
25 |
2 |
0.1 |
13 |
40 |
|
M Clarke 4-143(39.1) |
b Morkel |
151 |
176 |
72 |
22 |
40 |
284 |
|
M Hussey 5-158(44.3) |
c Boucher b Morkel |
1 |
18 |
1 |
0 |
143 |
158 |
|
B Haddin 6-163(45.5) |
c Prince b Steyn |
5 |
8 |
2 |
1 |
158 |
163 |
|
M Johnson 7-202(52.3) |
c Morkel b Philander |
20 |
22 |
8 |
2 |
163 |
202 |
|
R Harris 8-214(54.5) |
c Morkel b Philander |
5 |
10 |
3 |
0 |
202 |
214 |
|
P Siddle 9-273(72.4) |
c de Villiers b Morkel |
20 |
54 |
10 |
2 |
214 |
273 |
|
N Lyon |
not out |
3 |
15 |
1 |
0 |
273 |
284 |
|
Extras 17(b5, lb7, nb 4, w1) |
Scoring shots122(57x1s, 24 x2s, 4x3s, 36x4s, 1x6s) |
||||||
|
South Africa 1st Inn |
Overs |
mdns |
Runs |
Wkts |
Nb |
W |
SS |
4.6s |
L 3(%) |
C 3(%) |
|
D Steyn |
20 |
4 |
55 |
4 |
|
|
29 |
4 |
75.00 |
50.00 |
|
V Philander |
21 |
3 |
63 |
3 |
3 |
1 |
26 |
8.1 |
61.90 |
38.10 |
|
M Morkel |
18 |
2 |
82 |
3 |
1 |
|
34 |
13 |
33.33 |
5.56 |
|
I Tahir |
10 |
1 |
35 |
0 |
|
|
21 |
4 |
60.00 |
20.00 |
|
J Kallis |
6 |
0 |
37 |
0 |
|
|
12 |
7 |
0.00 |
0.00 |
|
Byes |
|
|
|
|
|
|
|
|
|
|
|
Leg byes |
|
|
|
|
|
|
|
|
|
|
|
Total |
75 |
10 |
284 |
10 |
4 |
1 |
122 |
36.1 |
53.33 |
32.00 |
|
South Africa (1st Inn) 96 all out (24.3)overs |
Runs |
Balls |
SS |
4.6s |
Begin-score |
End-score |
|
|
J Rudolph 1-24(6.5) |
b Harris |
18 |
29 |
8 |
1 |
0 |
24 |
|
G Smith 4-73(17.1) |
b Watson |
37 |
48 |
16 |
3 |
0 |
73 |
|
H Amla 2-49(13.2) |
lbw Watson |
3 |
16 |
2 |
0 |
24 |
49 |
|
J Kallis 3-49(14) |
c Ponting b Watson |
0 |
4 |
|
0 |
49 |
49 |
|
A de Villiers 6-77(18.1) |
lbw Harris |
8 |
9 |
2 |
2 |
49 |
77 |
|
A Prince 5-73(17.2) |
lbw Watson |
0 |
1 |
|
0 |
73 |
73 |
|
M Boucher 7-77(19.3) |
lbw Watson |
4 |
7 |
1 |
1 |
73 |
77 |
|
V Philander 8-81 (21) |
c Ponting b Harris |
4 |
11 |
1 |
1 |
77 |
81 |
|
D Steyn |
not out |
9 |
18 |
6 |
0 |
77 |
96 |
|
M Morkel 9-83(21.4) |
run out |
1 |
1 |
1 |
0 |
81 |
83 |
|
I Tahir 10-96(24.3) |
b Harris |
5 |
5 |
2 |
0 |
83 |
96 |
|
Extras 7 (lb 4, nb 2, w1) |
Scoring shots39(9x 1s, 18 x2s, 4x3s, 8x4s) |
||||||
|
Australia 1st Inn |
Overs |
mdns |
Runs |
Wkts |
Nb |
W |
SS |
4.6s |
L 3(%) |
C 3(%) |
|
R Harris |
10.3 |
3 |
33 |
4 |
1 |
|
15 |
2 |
48.54 |
29.13 |
|
M Johnson |
5 |
0 |
26 |
0 |
|
1 |
11 |
2 |
20.00 |
0.00 |
|
P Siddle |
4 |
1 |
16 |
0 |
1 |
|
7 |
1 |
25.00 |
0.00 |
|
S Watson |
5 |
2 |
17 |
5 |
|
|
6 |
3 |
60.00 |
40.00 |
|
Byes |
|
|
|
|
|
|
|
|
|
|
|
Leg byes |
|
|
|
|
|
|
|
|
|
|
|
Run out |
|
|
|
|
|
|
|
|
|
|
|
Total |
24.3 |
6 |
96 |
10 |
2 |
1 |
39 |
8.0 |
41.15 |
12.35 |
|
Australia 2nd Inn 47 all out (18)overs |
Runs |
Balls |
SS |
4.6s |
Begin-score |
End-score |
|
|
S Watson 1-4(0.3) |
lbw Steyn |
4 |
3 |
1 |
1 |
0 |
4 |
|
P Hughes 3-13(6.4) |
c Rudolph b Morkel |
9 |
22 |
4 |
1 |
0 |
13 |
|
R Ponting 2-11(5.3) |
lbw Philander |
0 |
12 |
0 |
0 |
4 |
11 |
|
M Clarke 5-15(7.3) |
lbw Philander |
2 |
6 |
1 |
0 |
11 |
15 |
|
M Hussey 4-13(6.5) |
c Prince b Morkel |
0 |
1 |
0 |
0 |
13 |
13 |
|
B Haddin 6-18 (9.1) |
c Boucher b Philander |
0 |
3 |
0 |
0 |
13 |
18 |
|
M Johnson 8-21(11.2) |
c Amla b Philander |
3 |
12 |
2 |
0 |
15 |
21 |
|
R Harris 7-21 (10.4) |
c Smith b Morkel |
3 |
7 |
1 |
0 |
18 |
21 |
|
P Siddle |
not out |
12 |
16 |
5 |
2 |
21 |
47 |
|
S Marsh 9-21(11.4) |
lbw Philander |
0 |
2 |
0 |
0 |
21 |
21 |
|
N Lyon 10-47(18) |
c de Villiers b Steyn |
14 |
24 |
7 |
1 |
21 |
47 |
|
Extras 0 |
Scoring shots 21(7x1s, 7x2s, 2x3s, 5x4s) |
||||||
|
South Africa 2nd Inn |
Overs |
mdns |
Runs |
Wkts |
SS |
4.6s |
L 3(%) |
C 3(%) |
|
D Steyn |
5 |
1 |
23 |
2 |
8 |
4 |
20.00 |
0.00 |
|
V Philander |
7 |
3 |
15 |
5 |
7 |
1 |
85.71 |
71.43 |
|
M Morkel |
6 |
1 |
9 |
3 |
6 |
|
100.00 |
83.33 |
|
Total |
18 |
5 |
47 |
10 |
21 |
5.0 |
72.22 |
50.00 |
Target: 236 Runs to win in 9 ½ sessions(approx 290 overs)
|
South Africa 2nd Inn 236-2 (50.2)overs |
Runs |
Balls |
SS |
4.6s |
Begin- Score |
End-Score |
|
|
G Smith |
not out |
101 |
140 |
45 |
15 |
0 |
236 |
|
J Rudolph 1-27 (6.4) |
c Haddin b Siddle |
14 |
24 |
5 |
3 |
0 |
27 |
|
H Amla2-222(47.4) |
c Clarke b Johnson |
112 |
134 |
42 |
21 |
27 |
222 |
|
J Kallis |
not out |
2 |
6 |
1 |
0 |
222 |
236 |
|
Rest of them did not bat |
|
|
|
|
|
|
|
|
Extras 7(lb4, nb2,w1) |
Scoring shots 93(39x1s, 11 x 2s, 4x 3s, 39x4s) |
||||||
|
Australia 2nd Inn |
Overs |
mdns |
Runs |
Wkts |
Nb |
W |
SS |
4.6s |
L 3(%) |
C 3(%) |
|
R Harris |
14 |
2 |
67 |
0 |
|
|
27 |
12 |
35.71 |
7.14 |
|
P Siddle |
12.2 |
0 |
49 |
1 |
1 |
|
21 |
6 |
57.38 |
32.79 |
|
S Watson |
10 |
0 |
44 |
0 |
|
|
16 |
8 |
50.00 |
30.00 |
|
M Johnson |
11 |
1 |
61 |
1 |
1 |
1 |
25 |
11 |
27.27 |
0.00 |
|
N Lyon |
3 |
1 |
11 |
0 |
|
|
4 |
2 |
33.33 |
0.00 |
|
Leg byes |
|
|
4 |
|
|
|
|
|
|
|
|
Total |
50.2 |
4 |
236 |
2 |
2 |
1 |
93 |
39.0 |
41.83 |
13.94 |
Explanation of indices used in this scorecard.
1st Test , Delhi. Nov (6-10)2011. India won by 5wkts.
|
West Indies 1st Inn 304 all out (108.2) Overs |
Runs |
Balls |
SS |
4.6s |
Begin- score |
End-score |
|
|
K Brathwaite 4-180(69.5) |
st Dhoni b Ojha |
63 |
212 |
46 |
4 |
0 |
180 |
|
K Powell 1-25(12) |
lbw b Ojha |
14 |
40 |
5 |
3 |
0 |
25 |
|
K Edwards 2-45 (23.3) |
c & b Ojha |
15 |
40 |
8 |
2 |
25 |
45 |
|
D Bravo 3-72(32.5) |
b Ashwin |
12 |
21 |
5 |
2 |
45 |
72 |
|
S Chanderpaul 8-281(101.2) |
lbw b Sharma |
118 |
196 |
71 |
7.2 |
72 |
281 |
|
M Samuels 5-200 (77.2) |
c Dhoni b Ashwin |
15 |
22 |
5 |
3 |
180 |
200 |
|
C Baugh 6-269 (99) |
lbw b Ojha |
27 |
71 |
17 |
3 |
200 |
269 |
|
D Sammy 7-281 (100.3) |
lbw b Ojha |
5 |
4 |
2 |
1 |
269 |
281 |
|
R Rampaul 9-304 (107.3) |
lbw b Ashwin |
12 |
21 |
5 |
2 |
281 |
304 |
|
F Edwards 10-304 (108.2) |
c Sehwag b Ojha |
10 |
21 |
4 |
2 |
281 |
304 |
|
D Bishoo |
not out |
0 |
3 |
0 |
0 |
304 |
304 |
|
Extras 13(b4, lb8,nb 1) |
Scoring shots 168(117x1s, 16x2s, 3x3s,29x4s, 1x5s,2x6s) |
||||||
|
India 1st Inn |
Overs |
mdns |
Runs |
Wkts |
Nb |
w |
ss |
4.6s |
L 3(%) |
C 3(%) |
|
I Sharma |
25 |
5 |
80 |
1 |
1 |
|
41 |
10.0 |
60.00 |
28.00 |
|
U Yadav |
19 |
5 |
52 |
0 |
|
|
30 |
6.0 |
63.16 |
31.58 |
|
P Ojha |
34.2 |
9 |
72 |
6 |
|
|
38 |
9.1 |
73.10 |
49.71 |
|
R Ashwin |
27 |
4 |
81 |
3 |
|
|
52 |
5.1 |
66.67 |
37.04 |
|
V Sehwag |
2 |
0 |
5 |
0 |
|
|
5 |
|
100.00 |
50.00 |
|
Yuvraj S |
1 |
0 |
2 |
0 |
|
|
|
|
100.00 |
0.00 |
|
byes |
|
|
4 |
|
|
|
|
|
|
|
|
leg byes |
|
|
8 |
|
|
|
|
|
|
|
|
total |
108.2 |
23 |
304 |
10 |
1 |
0 |
168 |
30.2 |
67.46 |
45.28 |
|
India 1st Inns 209 all out (52.5) overs |
Runs |
Balls |
SS |
4.6s |
Begin- score |
End-score |
|
|
G Gambhir 1-89(12.3) |
run out |
41 |
41 |
19 |
7 |
0 |
89 |
|
V Sehwag 2-100(15.4) |
st Baugh b Bishoo |
55 |
46 |
25 |
9 |
0 |
100 |
|
R Dravid 9-209 (52.4) |
c Sammy b Rampaul |
54 |
111 |
41 |
3 |
89 |
209 |
|
STendulkar 3-113(21) |
lbw b F Edwards |
7 |
18 |
3 |
1 |
100 |
113 |
|
V Laxman 4-120 (23.2) |
c Baugh b Bishoo |
1 |
5 |
1 |
0 |
113 |
120 |
|
Yuvraj 5-152(32.2) |
c K Edwards b Sammy |
23 |
39 |
7 |
2.2 |
120 |
152 |
|
M Dhoni 6-152(33) |
b Sammy |
0 |
4 |
0 |
0 |
152 |
152 |
|
R Ashwin 7-154 (35) |
c Baugh b Sammy |
0 |
6 |
0 |
0 |
152 |
154 |
|
I Sharma 8-203 (49.2) |
c Baugh b Samuels |
17 |
41 |
10 |
2 |
154 |
203 |
|
P Ojha |
not out |
3 |
7 |
3 |
0 |
203 |
209 |
|
U Yadav 10-209 (52.5) |
b Rampaul |
0 |
1 |
0 |
0 |
209 |
209 |
|
Extras 8 (b5, nb2, w1) |
Scoring shots 109 (73x1s, 10 x2s, 24x4s, 2x6s) |
||||||
|
West Indies (1st Inn) |
Overs |
mdns |
Runs |
Wkts |
Nb |
W |
ss |
4.6s |
L 3(%) |
C 3(%) |
|
F Edwards |
11 |
1 |
57 |
1 |
1 |
1 |
29 |
8.0 |
54.55 |
36.36 |
|
R Rampaul |
14.5 |
2 |
44 |
2 |
1 |
|
24 |
6.0 |
68.97 |
34.48 |
|
D Sammy |
8 |
1 |
35 |
3 |
|
|
18 |
5 |
37.50 |
12.50 |
|
D Bishoo |
14 |
0 |
55 |
2 |
|
|
27 |
5.2 |
64.29 |
35.71 |
|
M Samuels |
5 |
0 |
13 |
1 |
|
|
11 |
0 |
100.00 |
80.00 |
|
Byes |
|
|
5 |
|
|
|
|
|
|
|
|
leg byes |
|
|
0 |
|
|
|
|
|
|
|
|
Run out |
|
|
|
1 |
|
|
|
|
|
|
|
Total |
52.5 |
4 |
209 |
10 |
2 |
1 |
109 |
24.2 |
62.85 |
43.80 |
|
West Indies 2nd Inn 180 all out (57.3)overs |
Runs |
Balls |
SS |
4.6s |
Begin- score |
End-score |
|
|
K Brathwaite 2-17 (13.1) |
lbw b Ojha |
2 |
41 |
2 |
0 |
0 |
17 |
|
K Powell 1-0(1.4) |
c Gambhir b Ashwin |
0 |
4 |
0 |
0 |
0 |
0 |
|
K Edwards 4-53(27) |
b Yadav |
33 |
80 |
17 |
4 |
0 |
53 |
|
F Edwards 3-26(16.1) |
c Dhoni b Sharma |
1 |
8 |
1 |
0 |
17 |
26 |
|
D Bravo 5-63(29.2) |
lbw b Ashwin |
12 |
39 |
7 |
1 |
26 |
63 |
|
S Chanderpaul 8-124 (46) |
lbw b Ashwin |
47 |
58 |
24 |
7 |
53 |
124 |
|
M Samuels 6-63(30) |
b Ashwin |
0 |
4 |
0 |
0 |
63 |
63 |
|
C Baugh 7-84 (38.1) |
c Dhoni b Yadav |
7 |
26 |
7 |
0 |
63 |
84 |
|
D Sammy 9-157 (51.5) |
b Ashwin |
42 |
37 |
18 |
5.1 |
84 |
157 |
|
R Rampaul 10-180(57.3) |
c Ojha b Ashwin |
18 |
31 |
7 |
2.1 |
124 |
180 |
|
D Bishoo |
not out |
9 |
17 |
4 |
1 |
157 |
180 |
|
Extras 9(b1, lb 8) |
Scoring shots 87 (52x1s, 12x 2s, 1 x3s, 20x 4s, 2 x6s) |
||||||
|
India 2nd Inn |
Overs |
mdns |
Runs |
Wkts |
Nb |
w |
ss |
4.6s |
L 3(%) |
C 3(%) |
|
P Ojha |
14 |
4 |
37 |
1 |
|
|
17 |
4.1 |
57.14 |
42.86 |
|
R Ashwin |
21.3 |
5 |
47 |
6 |
|
|
24 |
6.0 |
65.73 |
42.25 |
|
Yuvraj S |
1 |
0 |
2 |
0 |
|
|
2 |
|
100.00 |
0.00 |
|
I Sharma |
14 |
2 |
49 |
1 |
|
|
27 |
4.1 |
64.29 |
35.71 |
|
U Yadav |
7 |
0 |
36 |
2 |
|
|
17 |
6.0 |
42.86 |
14.29 |
|
Byes |
|
|
1 |
|
|
|
|
|
|
|
|
leg byes |
|
|
8 |
|
|
|
|
|
|
|
|
Total |
57.3 |
11 |
180 |
10 |
0 |
0 |
87 |
20.2 |
62.82 |
38.39 |
Target set 276 Runs: Time period: 8 sessions (approx 230overs)
|
India 2nd Inn 276/5 of (80.4) overs |
Runs |
Balls |
SS |
4.6s |
Begin- score |
End-score |
||
|
G Gambhir 1-51 (9.5) |
lbw b Samuels |
22 |
32 |
13 |
3 |
0 |
51 |
|
|
V Sehwag 2-95 (18.1) |
b Sammy |
55 |
55 |
27 |
5.2 |
0 |
95 |
|
|
R Dravid 3-162(47.1) |
b F Edwards |
31 |
101 |
22 |
3 |
51 |
162 |
|
|
S Tendulkar 4-233 (63.5) |
lbw b Bishoo |
76 |
148 |
38 |
10 |
95 |
233 |
|
|
V Laxman |
not out |
58 |
105 |
36 |
6 |
162 |
276 |
|
|
Yuvraj. 5-275(79.2) |
b Sammy |
18 |
40 |
12 |
2 |
233 |
275 |
|
|
M Dhoni |
not out |
0 |
4 |
0 |
0 |
275 |
276 |
|
|
R Ashwin, I Sharma, P Oha & U Yadav : DNB |
|
|
||||||
|
Extras 16 (b1, lb14, nb 1) |
Scoring shots 149(104x 1s, 14x 2s, 29 x4s, 2x6s) |
|||||||
|
West Indies 2nd inn |
Overs |
mdns |
Runs |
Wkts |
Nb |
w |
Ss |
4.6s |
L 3(%) |
C 3(%) |
|
F Edwards |
15 |
3 |
51 |
1 |
|
|
24 |
9.0 |
53.33 |
26.67 |
|
R Rampaul |
10 |
0 |
34 |
0 |
1 |
|
20 |
3.0 |
60.00 |
40.00 |
|
D Sammy |
16 |
0 |
56 |
2 |
|
|
33 |
7.0 |
50.00 |
25.00 |
|
M Samuels |
16 |
0 |
57 |
1 |
|
|
32 |
5.1 |
43.75 |
18.75 |
|
D Bishoo |
22 |
2 |
56 |
1 |
|
|
35 |
4.1 |
72.73 |
40.91 |
|
K Brathwaite |
1.4 |
0 |
7 |
0 |
|
|
4 |
1.0 |
71.43 |
0.00 |
|
byes |
|
|
1 |
|
|
|
|
|
|
|
|
leg byes |
|
|
14 |
|
|
|
|
|
|
|
|
total |
80.4 |
5 |
276 |
5 |
1 |
|
149 |
29.2 |
57.21 |
37.31 |
|
New Zealand (1st inn) 426 all out (143.3)overs |
Runs |
Balls |
SS |
4.6ss |
Begin-score |
End-score |
Session-wise |
|
|
M Guptill 3-247(81.4) |
c Taibu b Masakadza |
109 |
236 |
57 |
11.2 |
0 |
247 |
|
|
B McCullum 1-40 (10.4) |
b Jarvis |
14 |
27 |
6 |
2.0 |
0 |
40 |
|
|
K Williamson 2-115(37.3) |
run out (Price/Chakabva) |
49 |
92 |
22 |
6 |
40 |
115 |
|
|
L Taylor 4-275(91.5) |
c Chakabva b Ncube |
76 |
165 |
42 |
9 |
115 |
275 |
|
|
B Watling 5-320(113) |
c Chakabva b Mpofu |
39 |
96 |
16 |
5 |
247 |
320 |
|
|
D Brownlie 6-401(131.4) |
c Taylor b Price |
63 |
133 |
28 |
7 |
275 |
401 |
|
|
D Vettori 7-407(136.5) |
c Taylor b Mpofu |
40 |
58 |
19 |
5.1 |
320 |
407 |
|
|
R Young |
not out |
9 |
35 |
5 |
1 |
401 |
426 |
|
|
D Bracewell 8-407(138.1) |
b Mpofu |
0 |
2 |
0 |
0.0 |
407 |
407 |
|
|
J Patel 9-425(142.5) |
c Mawoyo b Mpofu |
12 |
17 |
4 |
1.1 |
407 |
425 |
|
|
C Martin 10-426(143.3) |
b Price |
0 |
3 |
0 |
0.0 |
425 |
426 |
|
|
Extras 15(b7, lb 3, nb3, w 2) |
Scoring shots 199(105x1s, 35x 2s, 8 x 3s, 47 x 4s, 4 x6s) |
|||||||
|
Zimbabwe(1st Inn) |
Overs |
mdns |
Runs |
Wkts |
Nb |
w |
SS |
4.6s |
||
|
K Jarvis |
28 |
6 |
98 |
1 |
3 |
1 |
40 |
14 |
67.86 |
35.71 |
|
N Ncube |
25 |
4 |
80 |
1 |
|
|
34 |
11 |
56.00 |
28.00 |
|
C Mpofu |
34 |
10 |
92 |
4 |
|
1 |
44 |
10 |
64.71 |
35.29 |
|
R Price |
42.3 |
7 |
118 |
2 |
|
|
63 |
10.4 |
61.47 |
37.83 |
|
H Masakadza |
11 |
4 |
20 |
1 |
|
|
11 |
2 |
81.82 |
45.45 |
|
M Waller |
3 |
0 |
8 |
0 |
|
|
7 |
|
66.67 |
33.33 |
|
Byes |
|
|
7 |
|
|
|
|
|
|
|
|
leg byes |
|
|
3 |
|
|
|
|
|
|
|
|
run out |
|
|
0 |
1 |
|
|
|
|
|
|
|
Total |
143.3 |
31 |
426 |
10 |
3 |
2 |
199 |
47.4 |
64.20 |
42.57 |
|
Zimbabwe 1st inn 313 all out (121.5)overs |
Runs |
Balls |
SS |
4.6s |
Begin-score |
End-score |
Session-wise |
|
|
T Mawoyo 1-24 (12.5) |
c Watling b Vettori |
5 |
43 |
2 |
0 |
0 |
24 |
|
|
V Sibanda 3-159( 62) |
c Taylor b Brownlie |
93 |
193 |
43 |
11.1 |
0 |
159 |
|
|
H Masakadza 2-83(42) |
b Bracewell |
22 |
85 |
15 |
1 |
24 |
83 |
|
|
BM Taylor4-193(72.4) |
lbw Vettori |
50 |
75 |
27 |
3.2 |
83 |
193 |
|
|
T Taibu 5-198( 74.5) |
c Patel b Vettori |
20 |
47 |
11 |
2 |
159 |
198 |
|
|
M Waller |
not out |
72 |
133 |
32 |
9.1 |
193 |
313 |
|
|
R Chakabva 6-284(110.3) |
run out |
37 |
115 |
19 |
3 |
198 |
284 |
|
|
R Price 7-286 (112.3) |
lbw Vettori |
0 |
6 |
0 |
0 |
284 |
286 |
|
|
K Jarvis 8-299 (117.5) |
c Taylor b Martin |
6 |
20 |
2 |
1 |
286 |
299 |
|
|
C Mpofu 9-300 (118.5) |
c Williamson b Vettori |
0 |
5 |
0 |
0 |
299 |
300 |
|
|
N Ncube 10-313(121.5) |
b Martin |
3 |
10 |
2 |
0 |
300 |
313 |
|
|
Extras 5(lb3, nb1, w1) |
Scoring shots 153(86x1s, 21x 2s, 12 x 3s, 30 x 4s, 4 x6s) |
|
||||||
|
New Zealand(1st Inn) |
Overs |
mdns |
Runs |
Wkts |
Nb |
w |
ss |
4.6s |
||
|
C Martin |
25.5 |
6 |
74 |
2 |
|
|
34 |
9 |
62.75 |
35.29 |
|
D Bracewell |
23 |
12 |
51 |
1 |
1 |
1 |
18 |
8 |
69.57 |
39.13 |
|
D Vettori |
43 |
13 |
70 |
5 |
|
|
39 |
6 |
79.07 |
55.81 |
|
J Patel |
23 |
1 |
91 |
0 |
|
|
43 |
6.4 |
56.52 |
30.43 |
|
D Brownlie |
4 |
0 |
13 |
1 |
|
|
11 |
|
75.00 |
25.00 |
|
K Williamson |
2 |
0 |
9 |
0 |
|
|
6 |
1 |
0.00 |
0.00 |
|
M Guptill |
1 |
0 |
2 |
0 |
|
|
2 |
|
100.00 |
0.00 |
|
Byes |
|
|
0 |
|
|
|
|
|
|
|
|
leg byes |
|
|
3 |
|
|
|
|
|
|
|
|
run out |
|
|
0 |
1 |
|
|
|
|
|
|
|
Total |
121.5 |
32 |
313 |
10 |
1 |
1 |
153 |
30.4 |
68.31 |
42.80 |
|
New Zealand 2nd Inns 252 -8decl. 71(overs) |
Runs |
Balls |
SS |
4.6s |
Begin-score |
End-score |
Session-wise |
|
|
B McCullum 2-23(5.1) |
lbw Price |
11 |
14 |
7 |
1 |
0 |
23 |
|
|
M Guptill 1-5 ( 0.5) |
b Jarvis |
0 |
3 |
0 |
0 |
0 |
5 |
|
|
K Williamson 4-155(48.5) |
lbw Jarvis |
68 |
140 |
29 |
8.1 |
5 |
155 |
|
|
J Patel 3-36(11) |
b Jarvis |
9 |
24 |
5 |
0 |
23 |
36 |
|
|
L Taylor 6-179 (56.5) |
lbw Jarvis |
76 |
130 |
45 |
4.2 |
36 |
179 |
|
|
B Watling 5-167(53.4) |
c Taylor b Price |
3 |
22 |
1 |
0 |
155 |
167 |
|
|
D Vettori 8-236 (68.4) |
c Ncube b Mpofu |
31 |
42 |
20 |
3 |
167 |
236 |
|
|
D Brownlie 7-199 (60.5) |
b Jarvis |
9 |
13 |
4 |
0.1 |
179 |
199 |
|
|
R Young |
|
35 |
37 |
13 |
5.1 |
199 |
252 |
|
|
DJ Bracewell |
|
1 |
4 |
1 |
0 |
0 |
23 |
|
|
CS Martin DNB |
|
|
|
|
|
|
||
|
Extras 9(b3, lb3, nb3) |
Scoring shots 125(72x 1s, 24x 2s, 3 x3s, 21x 4s , 5 x6s) |
|
||||||
|
Zimbabwe(2nd Inn) |
Overs |
mdns |
Runs |
Wkts |
Nb |
w |
ss |
4.6s |
||
|
K Jarvis |
18 |
1 |
64 |
5 |
3 |
|
34 |
5.1 |
66.67 |
33.33 |
|
N Ncube |
10 |
0 |
41 |
0 |
|
|
19 |
5 |
40.00 |
0.00 |
|
R Price |
29 |
5 |
87 |
2 |
|
|
42 |
7.3 |
58.62 |
34.48 |
|
C Mpofu |
14 |
1 |
54 |
1 |
|
|
30 |
4.1 |
57.14 |
21.43 |
|
Byes |
|
|
3 |
|
|
|
|
|
|
|
|
leg byes |
|
|
3 |
|
|
|
|
|
|
|
|
Total |
71 |
|
252 |
8 |
3 |
0 |
125 |
21.5 |
57.75 |
33.80 |
Target of 366 in 4sessions (approx 115overs)
|
Zimbabwe 2nd inn 331 all out (108.1)overs |
Runs |
Balls |
SS |
4.6s |
Begin-score |
End-score |
Session-wise |
|
|
T Mawoyo 3-157( 48.2) |
b Guptill |
52 |
154 |
29 |
4 |
0 |
157 |
|
|
V Sibanda 1-25(8.2) |
lbw b Bracewell |
13 |
27 |
6 |
2 |
0 |
25 |
|
|
H Masakadza 2-61(23.4) |
c Brownlie b Bracewell |
19 |
47 |
8 |
3 |
25 |
61 |
|
|
B Taylor 4-265 (85.2) |
c Watling b Martin |
117 |
147 |
57 |
8.5 |
61 |
265 |
|
|
T Taibu 5-287( 94.3) |
c Guptill b Vettori |
63 |
163 |
32 |
6.1 |
157 |
287 |
|
|
M Waller 9-329 (106.1) |
lbw b Vettori |
29 |
62 |
20 |
3 |
265 |
329 |
|
|
R Chakabva 6-303(99.4) |
c Young b Bracewell |
5 |
18 |
3 |
0 |
287 |
303 |
|
|
N Ncube 7-321 (103.5) |
b Bracewell |
14 |
13 |
6 |
0.1 |
303 |
321 |
|
|
R Price 8-329( 105.5) |
c Young b Bracewell |
4 |
9 |
1 |
1 |
321 |
329 |
|
|
K Jarvis |
not out |
2 |
7 |
1 |
0 |
329 |
331 |
|
|
C Mpofu 10-331 (108.1) |
lbw b Bracewell |
0 |
6 |
0 |
0 |
329 |
331 |
|
|
Extras 13(b5, lb4 , nb 4) |
Scoring shots 163(93x 1s, 33x 2s, 3 x3s, 27x 4s 7×6) |
|
||||||
|
New Zealand( 2nd Inn) |
Overs |
mdns |
Runs |
Wkts |
Nb |
w |
ss |
4.6s |
||
|
C Martin |
22 |
3 |
85 |
1 |
|
|
36 |
10 |
68.18 |
45.45 |
|
D Bracewell |
25 |
2 |
85 |
5 |
4 |
|
46 |
8 |
60.00 |
20.00 |
|
D Vettori |
38.1 |
14 |
71 |
3 |
|
|
37 |
7.1 |
76.12 |
44.62 |
|
J Patel |
13 |
1 |
51 |
0 |
|
|
24 |
1.4 |
46.15 |
15.38 |
|
M Guptill |
9 |
0 |
28 |
1 |
|
|
17 |
1.1 |
77.78 |
44.44 |
|
D Brownlie |
1 |
0 |
2 |
0 |
|
|
2 |
|
0.00 |
0.00 |
|
byes |
|
|
5 |
|
|
|
|
|
|
|
|
leg byes |
|
|
4 |
|
|
|
|
|
|
|
|
total |
108.1 |
20 |
331 |
10 |
4 |
|
163 |
27.7 |
66.60 |
45.33 |
Explanation of indices used in this scorecard : http://allthatcricket.com/archives/1489
 embedded by Embedded Video
With Decision Review "Software" technology, magic eye can be of great help for on-field umpires. 
")

Can there be unlimited DRS ?. …and if so, will it be time consuming for officials!
If one wants to improve the game, than criteria should be to maximise technology.
Let the 3rd Umpire with reserve umpire do more work, viz take calls on wrong decision made by on-field umpires, and ask them to revert.
And at the same time, take away DRS appeal from players. They cannot decide whether they are out or not.
Today, all broadcasters are well equipped to the standard requirement in taking care of DRS technology. It takes less than 20 seconds to replay the previous ball bowled, from which one can make out whether it was right or wrong decision. The criteria for fielding side is to appeal, than its upto umpires(all of them) to decide on the decision.
I am certain there is a constant feed on various required angle for 3rd /reserve umpires in the box, from which they can find
1- no balls bowled
2- low catches
3- rope catches/fieldings
4- run outs
and many close actions.
I certain if this takes place, we would have zero error.
And as far as on-field umpire getting slack, than points should be given on number and type of errors made by them, which should be their performance evaluation. The lesser the errors(difficult ones), the better umpires.
