
Analysis


This gallery contains 2 photos.
In the wake of rise in suspect bowling action at all levels. I thought it would be appropriate to share the fundamentals of overarm bowling. Below are few videos and links for the same. Bowling engine – an … Continue reading

This gallery contains 38 photos.
Here are few videos explaining fundamentals of batting [huge_it_videogallery id=”6″] [huge_it_videogallery id=”7″]

This gallery contains 2 photos.
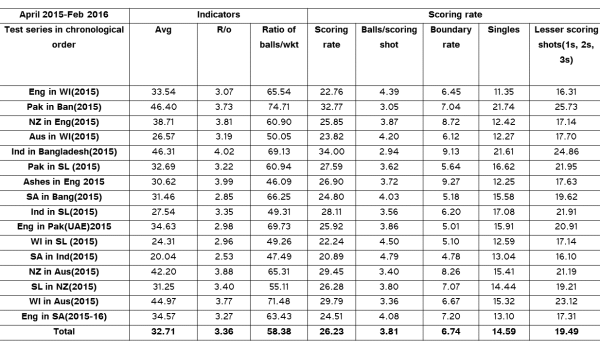
Based on last 7 T20 Int matches, bowlers have an upper hand, hence teams are not able to post big score consistently, especially in these two series – Ind v SL & SA v Eng. Analysis is based on 3 series … Continue reading

This gallery contains 1 photo.
When Steve Smith took over Test captaincy from Michael Clarke, he became the 45th player to lead Australia. Now with one Test to play in New Zealand, Australia is on the verge of becoming the No.1 Test team in the … Continue reading

This gallery contains 6 photos.
Here is a short analysis of Big Bash League 5. Sydney Thunder won this year’s tournament, however the favorites were Perth Scorchers and Adelaide Strikers who came 3rd and 4th – The finals was a fantastic chase by Thunders against … Continue reading
This gallery contains 3 photos.
A look at how Test matches has progressed since WC 2015. Australia play in New Zealand for a short 2-Test series. This would be the 17th Test series and 45th Test match to be played since last April. Performance wise 84 … Continue reading
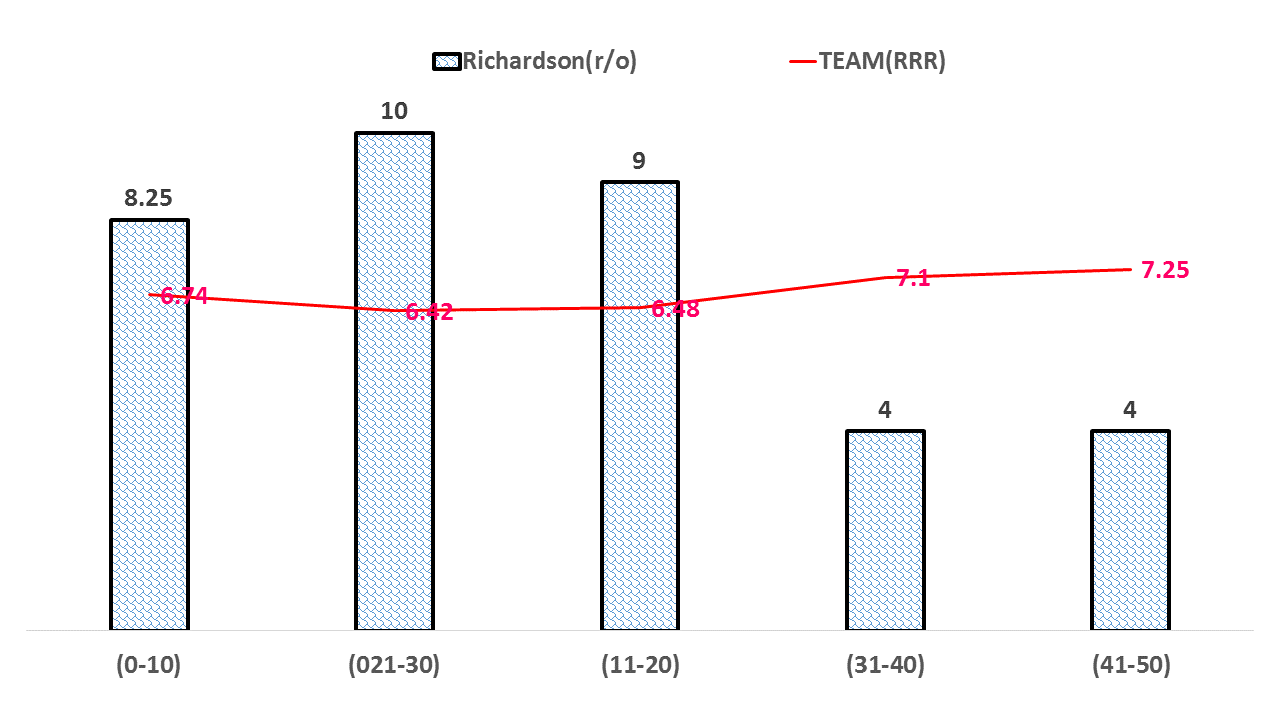
Australia’s bowling dilemma – their predicament in ODI is lack of strike bowlers, and in last few games they are trying various players to open the bowling in limited overs cricket.
Keeping that in mind, I looked at their bowling figures in various stage of 10 over phase while defending(2nd bowling) since WCUP2015, and compare their run-rate with team’s required run-rate.
Since WCUP-2015 six times Australia batted first, won 4 games and lost 2. Apart from Ireland match(rain reduced to 40-over game), they manage to set 300 or more score in all games for their opponent to chase.
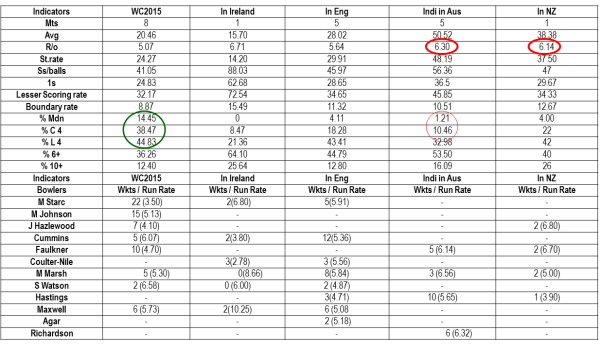
Here is how they performed. In below stats display I have only selected bowlers who are currently playing in the ongoing Chappell-Hadlee Trophy in New Zealand.
Here is graphic display of their bowling performance against RRR.
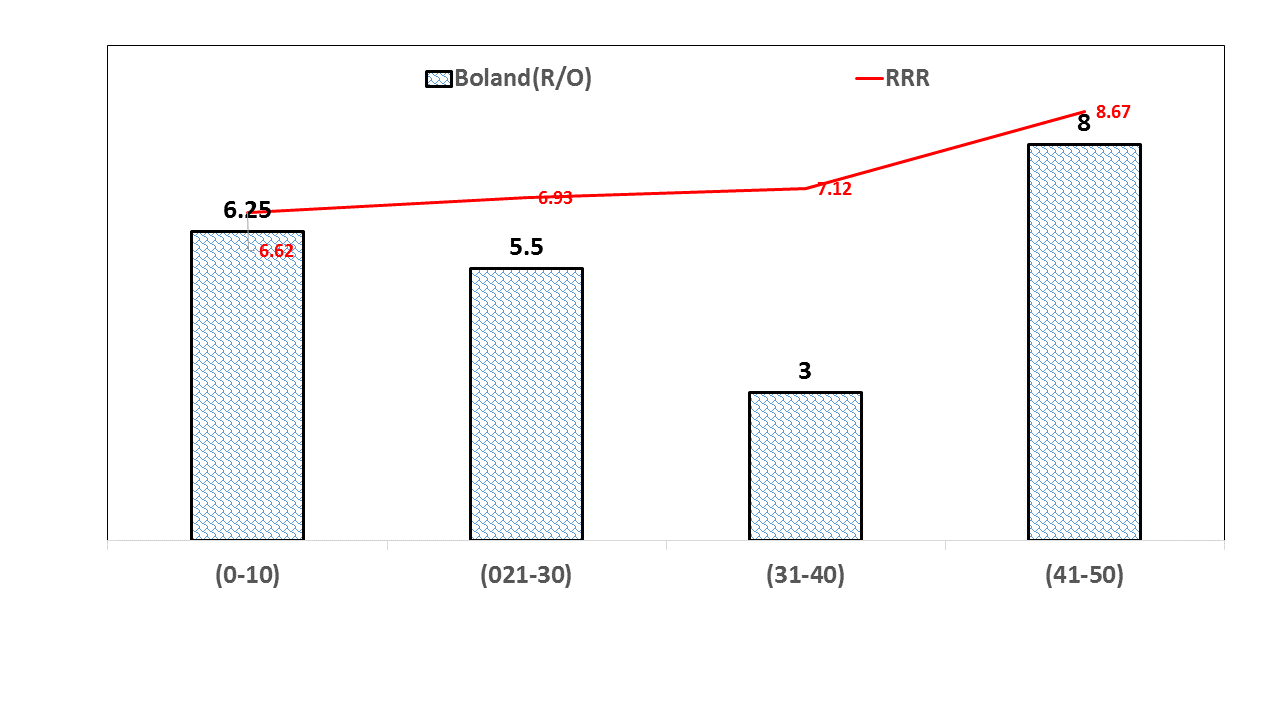

Here is the detailed bowling analysis in table format. The second column is the team’s asking rate- which is followed by bowler’s analysis in each phase while defending.
| Bowlers in each phase | Team’s(RRR) | Balls | Runs | Wk | r/o | ss/balls | 4s | 1s | lesser s.s |
| Boland | 6.62 | 60 | 58 | 0 | 5.80 | 53.33 | 10.00 | 33.33 | 43.33 |
| (0-10) | 6.62 | 24 | 25 | 0 | 6.25 | 45.83 | 16.67 | 20.83 | 29.17 |
| (021-30) | 6.93 | 12 | 11 | 0 | 5.50 | 41.67 | 8.33 | 25.00 | 33.33 |
| (31-40) | 7.12 | 12 | 6 | 0 | 3.00 | 50.00 | 0.00 | 50.00 | 50.00 |
| (41-50) | 8.67 | 12 | 16 | 0 | 8.00 | 83.33 | 8.33 | 50.00 | 75.00 |
| Faulkner | 6.32 | 103 | 105 | 0 | 6.12 | 58.25 | 8.74 | 37.86 | 49.51 |
| (0-10) | 6.49 | 12 | 13 | 0 | 6.50 | 58.33 | 16.67 | 41.67 | 41.67 |
| (021-30) | 6.32 | 24 | 27 | 0 | 6.75 | 66.67 | 8.33 | 45.83 | 58.33 |
| (11-20) | 6.57 | 24 | 28 | 0 | 7.00 | 58.33 | 16.67 | 33.33 | 41.67 |
| (31-40) | 6.76 | 6 | 5 | 0 | 5.00 | 66.67 | 0.00 | 50.00 | 66.67 |
| (41-50) | 8.20 | 37 | 32 | 0 | 5.19 | 51.35 | 2.70 | 32.43 | 48.65 |
| Hastings | 5.75 | 162 | 167 | 5 | 6.19 | 51.23 | 11.73 | 30.25 | 39.51 |
| (0-10) | 5.75 | 61 | 65 | 0 | 6.39 | 49.18 | 14.75 | 26.23 | 34.43 |
| (021-30) | 6.05 | 24 | 14 | 1 | 3.50 | 41.67 | 4.17 | 33.33 | 37.50 |
| (11-20) | 5.84 | 20 | 20 | 1 | 6.00 | 45.00 | 10.00 | 30.00 | 35.00 |
| (31-40) | 6.06 | 55 | 61 | 3 | 6.65 | 58.18 | 10.91 | 32.73 | 47.27 |
| (41-50) | 12.00 | 2 | 7 | 0 | 21.00 | 100.00 | 50.00 | 50.00 | 50.00 |
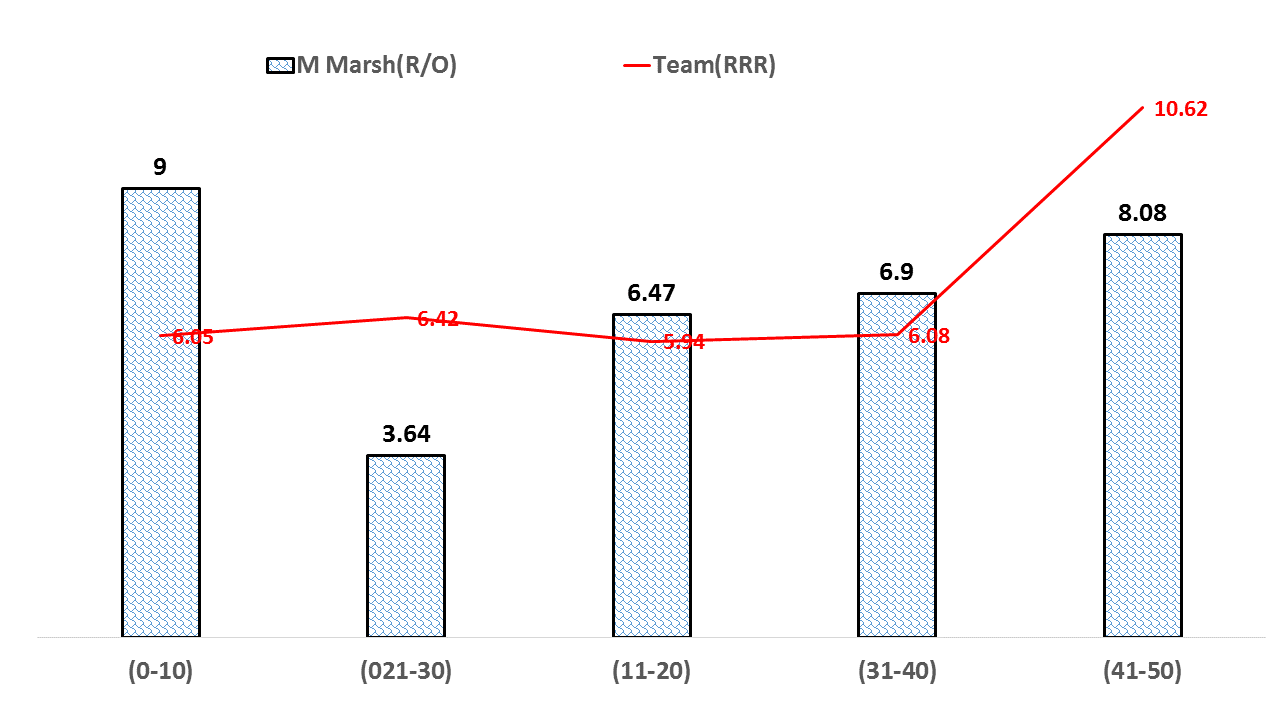
| M Marsh | 5.94 | 271 | 301 | 7 | 6.66 | 57.93 | 11.44 | 37.27 | 46.49 |
| (0-10) | 6.05 | 30 | 45 | 0 | 9.00 | 56.67 | 23.33 | 26.67 | 33.33 |
| (021-30) | 6.42 | 33 | 20 | 1 | 3.64 | 45.45 | 0.00 | 42.42 | 45.45 |
| (11-20) | 5.94 | 115 | 124 | 2 | 6.47 | 61.74 | 9.57 | 41.74 | 52.17 |
| (31-40) | 6.08 | 67 | 77 | 1 | 6.90 | 58.21 | 13.43 | 35.82 | 44.78 |
| (41-50) | 10.62 | 26 | 35 | 3 | 8.08 | 57.69 | 15.38 | 26.92 | 42.31 |
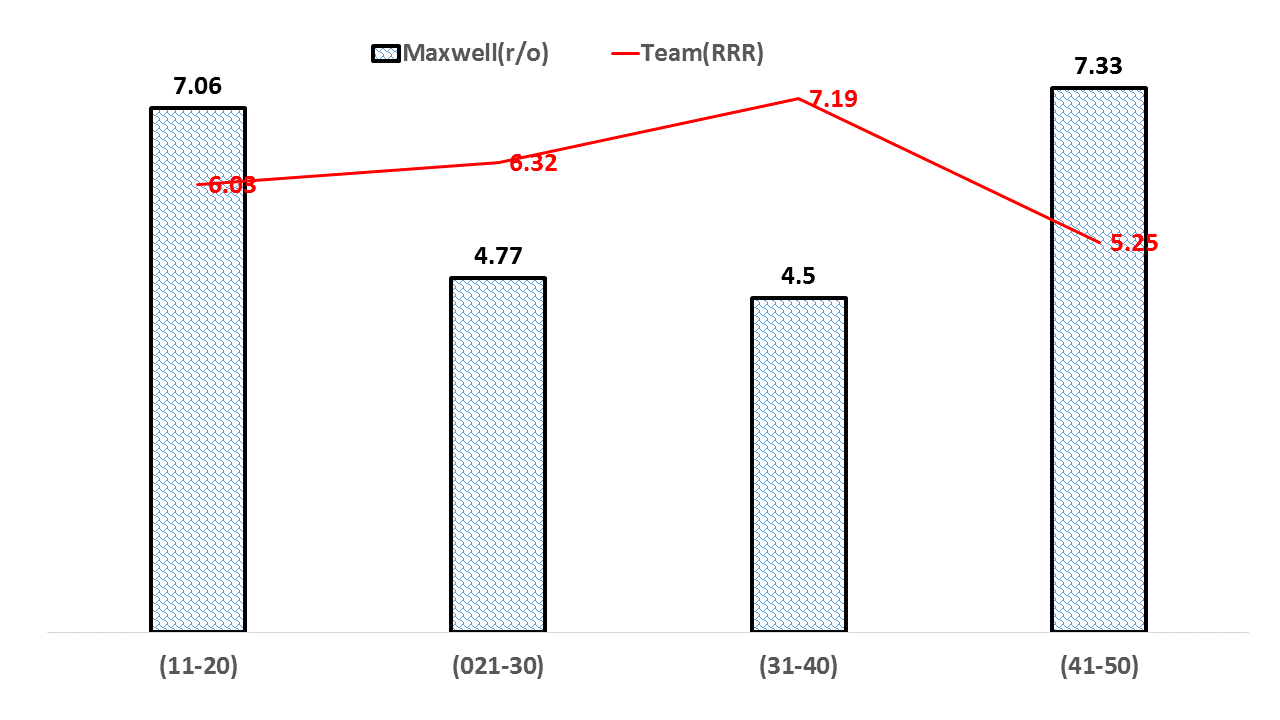
| Maxwell | 5.25 | 189 | 180 | 6 | 5.71 | 56.61 | 7.41 | 41.27 | 49.21 |
| (021-30) | 6.32 | 73 | 58 | 1 | 4.77 | 53.42 | 5.48 | 43.84 | 47.95 |
| (11-20) | 6.03 | 62 | 73 | 3 | 7.06 | 66.13 | 8.06 | 41.94 | 58.06 |
| (31-40) | 7.19 | 36 | 27 | 1 | 4.50 | 47.22 | 5.56 | 36.11 | 41.67 |
| (41-50) | 5.25 | 18 | 22 | 1 | 7.33 | 55.56 | 16.67 | 38.89 | 38.89 |
| Richardson | 6.42 | 60 | 68 | 5 | 6.80 | 43.33 | 15.00 | 15.00 | 28.33 |
| (0-10) | 6.74 | 24 | 33 | 1 | 8.25 | 41.67 | 20.83 | 16.67 | 20.83 |
| (021-30) | 6.42 | 6 | 10 | 0 | 10.00 | 50.00 | 33.33 | 0.00 | 16.67 |
| (11-20) | 6.48 | 6 | 9 | 0 | 9.00 | 66.67 | 16.67 | 16.67 | 50.00 |
| (31-40) | 7.10 | 6 | 4 | 1 | 4.00 | 50.00 | 0.00 | 33.33 | 50.00 |
| (41-50) | 7.25 | 18 | 12 | 3 | 4.00 | 33.33 | 5.56 | 11.11 | 27.78 |
| S Smith | 6.21 | 24 | 36 | 0 | 9.00 | 75.00 | 25.00 | 50.00 | 50.00 |
| (021-30) | 6.21 | 18 | 24 | 0 | 8.00 | 66.67 | 22.22 | 44.44 | 44.44 |
| (31-40) | 6.78 | 6 | 12 | 0 | 12.00 | 100.00 | 33.33 | 66.67 | 66.67 |
| Stoinis | 6.64 | 24 | 17 | 0 | 4.25 | 45.83 | 8.33 | 37.50 | 37.50 |
| (021-30) | 6.64 | 24 | 17 | 0 | 4.25 | 45.83 | 8.33 | 37.50 | 37.50 |
All data is updated at end of 1st ODI –Chappell-Hadlee Trophy
This gallery contains 5 photos.
Test team’s T20I list. If Khawaja selected, he becomes 79th Aussie.Of which 51.28% played <5 mts In T20I 46.59% have played =< 5 games!. Here is list of Test playing teams A very useful read for all. … Continue reading
[huge_it_videogallery id=”1″] I took a dip by the shoreline and realised mechanics of swimming are slightly different. In open water navigation is aided by flow of water, viz wave which is always constant but in varying degree. Keeping the balance of … Continue reading
This gallery contains 2 photos.
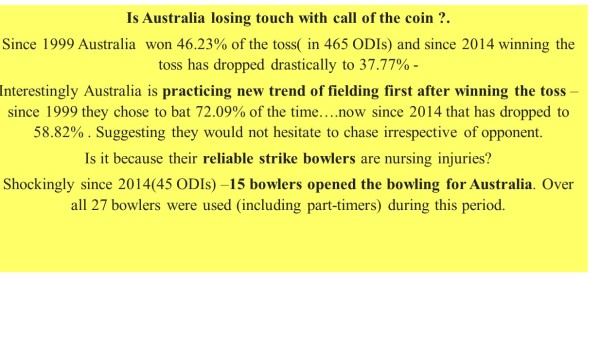
Post WC 2015 Australia defense(bowling) has weakened. They have lost their strike bowlers to retirement & injuries. And the current lot of bowlers not only lack in penetration but also cannot defend a sizable target(excess of 275 score)..this despite the … Continue reading
In last three T20I games Australia had won the toss and chose to field. In all these 3 games they were asked to chase in excess of 180 or more runs. Besides managing to get a solid start from … Continue reading