There is a remarkable rise for Ireland in less than 10 years of Int. cricket, especially in Batting – which one feels is the right way to become better and successful team. If you bat well consistently and score good enough runs(see partnership gfx below), than your bowlers will get an opportunity to bowl with freedom(have attacking field when required) and use all skills without being constrained
The beginning(2006-2007) The Announcement
Ireland played their first Int. ODI in June 2006 against England at Belfast. Next year they qualified for the CWC2007 in West Indies, where they surprised everyone by beating Pakistan and Bangladesh in a low scoring contest!.
That was the only two wins they had. Primary reason for not going further. Their inability to accumulate enough runs in a 50-over match. Their batting average in that World Cup was below par @18.38 – almost double they conceded in their bowling- avg 35.05. Before this WC2007 they had a decent Bat avg @32.47 between June 2006-2007.
The second World Cup –CWC2011. The Rising
After WC2007 one saw a rise in their performance. From 2007 till the beginning of next WC (2011) their success rate was 58.53% – In this period they had the opportunity of playing at least one game against top nation, and had success against Bangladesh and Zimbabwe. In this period their Bat Avg 27.35 v/s Bowl 25.55 a much improved performance.
In this period they found their success formula- viz chasing targets wining 65.00 % (13/20). This formula helped them gain confidence in the CWC2011. As they shocked everyone by beating England in Bangalore chasing a target of 328 – They repeated this by beating Holland chasing 307 at Kolkata.
2011-2015 phase
They continue their winning formula as this period saw them win 60.00% of 10 games chasing. Overall success was 44.00
The batting Avg 27.42 v/s Bowl Avg 26 remained constant in this period. As 76.00(19/25) games were played at home. In this period they lost 3 out of 4 games against Pakistan, and one was tied.
This tied game was an interesting one, as they were asked to chase 276(D/L method) after Pakistan scored 266 in 47 overs. Thanks to Paul Stirling and Kevin O’Brien they manage to tie this game. here is a Cricinfo link to that game -http://www.espncricinfo.com/ireland/engine/match/601612.html.
CWC2015: Derailed!.
They had an excellent start to CWC2015 beating West Indies at Nelson Park(NZ), chasing down a target of 305 with 5 overs remaining. They repeated their success chasing 270 against UAE, than they lost badly (Target 411) to South Africa. Then they manage to keep their nerve defending 331 against Zimbabwe which gave them hope to qualify for WC Quarter finals…
And one expected them to qualify – but they lost their last two games poorly, and here (hindsight) one thought they should have fielded after winning the toss.In both games (India and Pakistan) they started well but lost foot hold (batting sank like quick sand)in last 10 overs.
The last 10 overs of their last two games(first bat)
- Against India they manage to score only 47 runs, and lost 5 wickets…
- Against Pakistan they manage to score 49 runs, and lost 5 wickets
And it was an easy chase for both teams as they won their games with more 7 wickets to spare.
Here is a result summary of their three World Cup performance.
| World Cups | mts | Won | lost | Won against |
| 2007 | 9 | 2 | 7 | Pak and Bangladesh |
| 2011 | 6 | 2 | 4 | England and Holland |
| 2015 | 6 | 3 | 3 | WI, UAE & Zim |
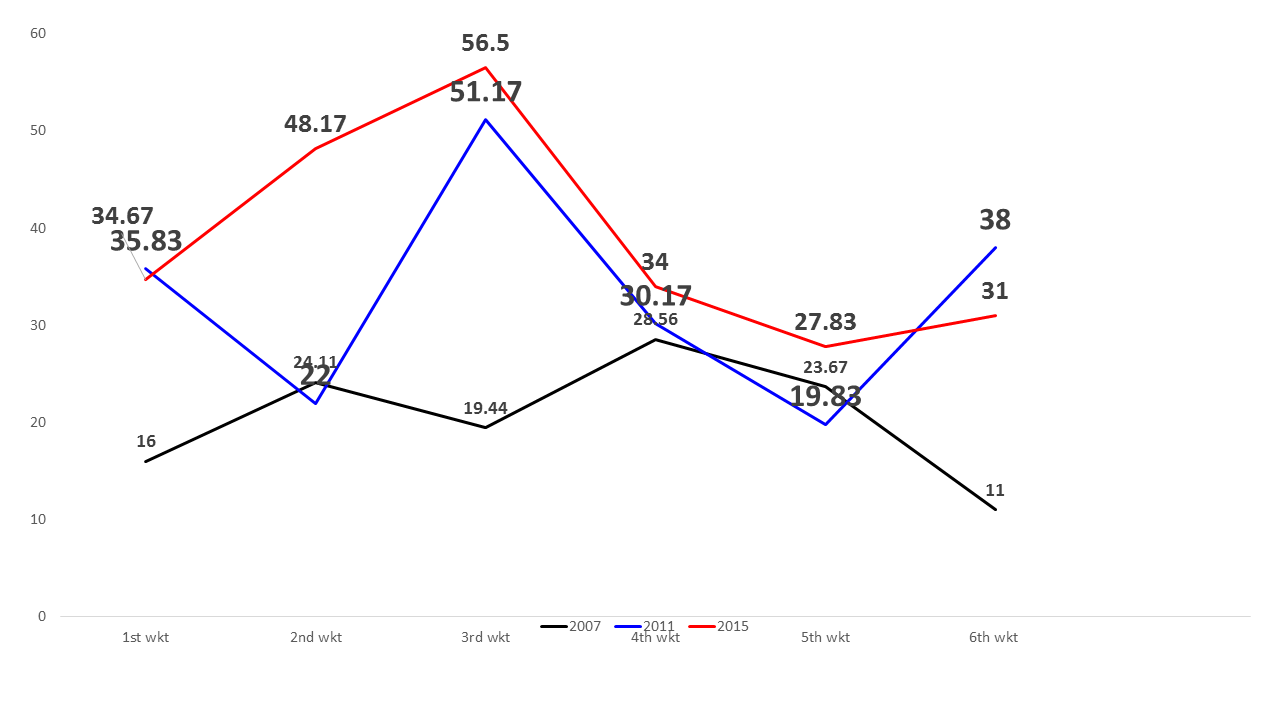
A look at how their partnerships progressed in these three World Cups (Top 6 wicket).
| Partnerships | 2007 | 2011 | 2015 |
| 1st wkt | 16 | 35.83 | 34.67 |
| 2nd wkt | 24.11 | 22 | 48.17 |
| 3rd wkt | 19.44 | 51.17 | 56.50 |
| 4th wkt | 28.56 | 30.17 | 34.00 |
| 5th wkt | 23.67 | 19.83 | 27.83 |
| 6th wkt | 11 | 38.00 | 31.00 |
A quick look at their primary indicators and their gap factor for previous World Cups
| Ireland 2007 | Batting | Bowling | Gap between bat and bowl |
| Avg | 18.38 | 29.79 | -11.41 |
| R/o | 3.95 | 4.81 | -0.86 |
| Scoring rate | 35.17 | 38.70 | -3.53 |
| Boundary rate | 5.48 | 8.61 | -3.13 |
| Ireland 2011 | Batting | Bowling | Gap between bat and bowl |
| Avg | 27.31 | 31.90 | -4.59 |
| R/o | 5.14 | 5.40 | -0.26 |
| Scoring rate | 42.76 | 49.60 | -6.84 |
| Boundary rate | 9.75 | 9.37 | 0.38 |
A statistical analysis of concluded CWC2015-
| Ireland (mts 6, Won 3) | Batting | Bowling | Gap between bat and bowl |
| Runs scored/conceded | 1623 | 1820 | -197 |
| Wkts lost/taken | 52 | 35 | -17 |
| Avg | 31.21 | 52.00 | -20.79 |
| R/o | 5.62 | 6.46 | -0.84 |
| Scoring rate | 48.59 | 51.09 | -2.5 |
| Boundary rate | 10.20 | 12.09 | -1.89 |
| Centuries | 2 | 7 | -5 |
| Top 4 batsmen(contribution) | 60.01 | 52.47 | 7.54 |
| Eco rate | |||
| Maiden over | 1.39 | 2.84 | 1.45 |
| Consecutive < 4 runs/overs (C 4) | 22.51 | 21.99 | -0.52 |
| < 4 runs/over (L 4) | 45.72 | 43.63 | -2.09 |
| >6 runs /over (6+) | 43.64 | 51.08 | -7.44 |
| >10 runs/over (10+) | 13.16 | 19.87 | -6.71 |
| Powerplay(Batting) | |||
| Avg | 41.60 | 64.00 | -22.4 |
| R/O | 4.90 | 5.30 | -0.4 |
| Scoring rate | 33.60 | 42.70 | -9.1 |
| Boundary rate | 10.60 | 14.30 | -3.7 |
| Maiden over | 3.33 | 11.70 | 8.37 |
| Consecutive < 4 runs/overs (C 4) | 23.30 | 23.30 | 0 |
| < 4 runs/over (L 4) | 51.70 | 51.70 | 0 |
| >6 runs /over (6+) | 36.70 | 43.30 | -6.6 |
| >10 runs/over (10+) | 10.00 | 15.00 | -5 |
| Powerplay(second ) | |||
| Avg | 31.10 | 88.00 | -56.9 |
| R/O | 7.30 | 9.10 | -1.8 |
| Scoring rate | 59.40 | 72.70 | -13.3 |
| Boundary rate | 15.00 | 25.90 | -10.9 |
| Maiden over | 0.00 | 0 | 0 |
| Consecutive < 4 runs/overs (C 4) | 16.70 | 6.90 | -9.8 |
| < 4 runs/over (L 4) | 23.30 | 20.70 | -2.6 |
| >6 runs /over (6+) | 63.30 | 75.90 | -12.6 |
| >10 runs/over (10+) | 23.30 | 41.40 | -18.1 |
| Partnerships | Bat | Bowl |
| Partnerships (>100 runs) | 2 | 6 |
| Opening stand avg | 34.67 | 62.00 |
| (>100 runs) top order(I,II, III) | 2 | 3 |
| (> 100) middle order(IV,V, VI) | 0 | 3 |
| (>50s) lower order(VII, VIII, IX, X) | 0 | 1 |
| Method of dismissals | Bat | Bowl |
| LBW | 3.84 | 8.57 |
| Bowled | 7.69 | 8.57 |
| Run out | 7.69 | 5.71 |
links to all the stats indicators http://allthatcricket.com/?p=1489
