I was reading on how Australian domestic tournaments (Sheffield Shield,BBL , Ford Cup) is responsible for Australia’s poor Test performance. It seems variable weather, pitch conditions, and scheduling is responsible for their poor performance.
I have never been to Australia therefore cannot contradict this view of theirs, but I do understand there is enough data to prove otherwise. Hence I dug deep to observe objectively why Aussies performed poorly in ongoing Ashes series.
And surprisingly I didn’t have to look very deep…its “far away from home”.
Hence I feel Aussies need to replicate their home performance in away series to win Test matches and series.
Therefore let us look at Australia’s performance in three different eras and snap shot of their Test performance in last 14 years.
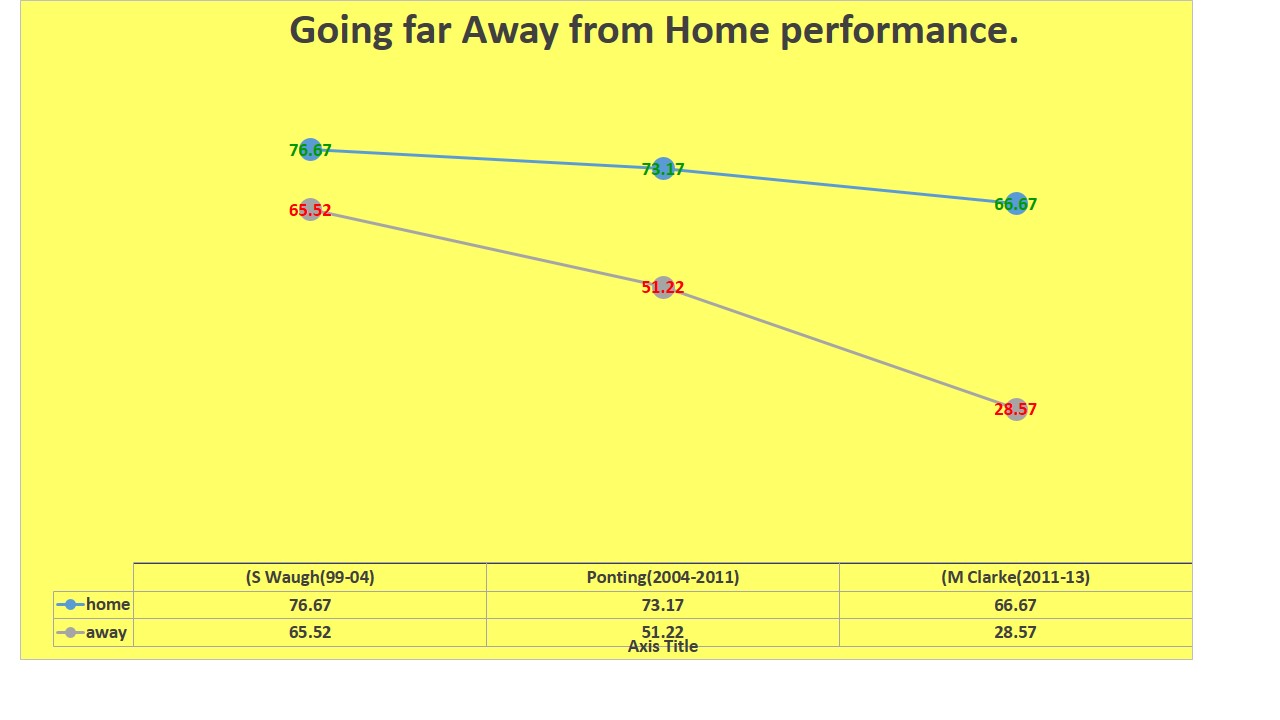
We start with current era under Michael Clarke.
A – Michael Clarke (2011-2013)
| Michael Clarke | Batting | Bowling | |||
| Home | Away | Indices | Home | Away | |
| Tests | 12 | 14 | Tests | 12 | 14 |
| Won | 8 | 4 | Won | 8 | 4 |
| >400(1st inn) | 8 | 4 | < 300(1st Inn) | 9 | 8 |
| Bat Avg | 42.86 | 28.20 | Bowl Avg | 26.67 | 33 |
| B /w | 68.52 | 57.25 | B/W | 52.21 | 63.20 |
| R/O | 3.76 | 2.97 | R/O | 3.06 | 3.13 |
| Centuries | 17 | 8 | Centuries | 7 | 12 |
| Opening stand | 46.47 | 32.37 | 5wi | 8 | 11 |
| Top 4 Batsman(%) | 40.28% | 38.96 % | 10 wkt/match | 0 | 0 |
Under Clarke Australia did well at home, but not in away series. Winning only 4 Tests in 14 is not what he or the Australia selectors want their team to be while traveling overseas.
Batting:
It’s their batting which has let them down at away games, with average runs/wkt = 28.20 and top 4 batsmen contributing only 39% of total runs scored in every inn.
In 4 tests they conceded 150plus lead which cost them dearly.
Partnerships: The opening stand is quite modest @ 32.37., than average for 2nd wkt = 23.81, 3rd wkt = 27.78
Batting position: Their No.3(32.04) and No 4 (18.70)have performed poorly. These position are vital along with openers, but under M Clarke, only 1 century was scored (S Marsh) at No3 and none at No.4. So far 8 players were used at No 3.
Bowling:
The bowling performance is much better
1- but far from consistent.
2- In the second innings they lose their wheels after getting early break – they are unable to break partnerships in the middle order (II(40), III(33), IV(49.44), V( 40.22)VI ( 40.00)
3- More centuries(12) are scored against them, compare to their batsmen(8) scoring
4- In terms of most wickets, P Siddle and N Lyon have taken 50 or more wickets under Clarke’s captaincy, but lately Lyon has not been very effective in away games. Watson lately has not been picking wickets for Australia. Harris and Siddle have done well consistently, they require support from others for Australia to be effective as a bowling unit. Smith’s performance with the ball is a good news for Australia, and if he is able to pick wickets consistently, than Australia have a chance of winning games overseas.
Few Tests which they could have won instead of drawing or losing badly!.
1- Pallekele – Drawn
2- Colombo – Drawn
3- Cape Town – lost by 8 wkts
4- Chennai – lost by 8 wkts
5- Delhi -lost by 6 wkts
6- Trent Bridge – lost by 14 runs
Now a quick look at how Australia performed under Ponting and S Waugh.
B – Ricky Ponting (2004-2011)
| Ponting | Batting | Bowling | |||
| Home | Away | Indices | Home | Away | |
| Tests | 41 | 54 | Tests | 41 | 54 |
| Won | 30 | 41 | Won | 30 | 41 |
| >400(1st inn) | 25 | 21 | < 300(1st Inn) | 21 | 18 |
| Bat Avg | 42.77 | 37.16 | Bowl Avg | 29.45 | 31.09 |
| B /w | 71.50 | 65.33 | B/W | 57.49 | 55.56 |
| R/O | 3.60 | 3.42 | R/O | 3.07 | 3.35 |
| Centuries | 58 | 54 | Centuries | 34 | 30 |
| Opening stand | 50.13 | 45.67 | 5wi | 26 | 30 |
| Top 4 Batsman(%) | 52.66% | 50.83% | 10 wkt/match | 2 | 6 |
C – Steve Waugh (1999-2004)
| S Waugh | Batting(1999-2004) | Bowling(1999-2004) | |||
| Home | Away | Indices | Home | Away | |
| Tests | 30 | 29 | Tests | 30 | 29 |
| Won | 23(76.66) | 19(65.51) | Won | 23 | 19 |
| >400(1st inn) | 23 | 15 | < 300(1st Inn) | 18 | 22 |
| Bat Avg | 49.44 | 37.37 | Bowl Avg | 28.40 | 26.87 |
| B /w | 78.69 | 62.98 | B/W | 56.17 | 52.39 |
| R/O | 3.77 | 3.55 | R/O | 3.03 | 3.07 |
| Centuries | 48 | 42 | Centuries | 22 | 18 |
| Opening stand | 57.34 | 41.80 | 5wi | 21 | 19 |
| Top 4 Batsman(%) | 53.40% | 51.86% | 10 wkt/match | 4 | 3 |
A snap of shot of Away series performance between (1998-2013)
Here I have used 1st Innings performance only, viz average runs scored and conceded by Australian team overseas.
1- The first innings is a base score and Australia were averaging pretty well
2- The first column is series No. in chronicle order(not including home series)
3- The first series was captained by Mark Taylor, followed by S Waugh (in pink color), then by Ponting (indigo color) and now by M Clarke(red color)
Batting wise:
| Series wise (1998-2013) | 1st Inn. | Victory | Avg score | Avg overs | 100.s |
| 01-Pakistan | 3 | 1 | 464.00 | 157.60 | 4 |
| 03-West Indies | 4 | 2 | 329.50 | 114.35 | 3 |
| 04-Sri Lanka | 3 | 0 | 252.67 | 99.93 | 1 |
| 05-Zimbabwe | 1 | 1 | 422.00 | 139.40 | 1 |
| 08- New Zealand | 3 | 3 | 295.00 | 84.20 | 2 |
| 10-India | 3 | 1 | 395.00 | 106.63 | 4 |
| 11-England | 5 | 4 | 451.00 | 107.42 | 9 |
| 14-South Africa | 3 | 2 | 449.67 | 100.20 | 4 |
| 15-Pakistan | 3 | 3 | 407.00 | 112.30 | 4 |
| 17-West Indies | 4 | 3 | 477.50 | 118.50 | 7 |
| 21-Sri Lanka | 3 | 3 | 247.00 | 75.20 | 1 |
| 23-India | 4 | 2 | 327.50 | 90.70 | 3 |
| 26-New Zealand | 3 | 2 | 461.67 | 127.10 | 5 |
| 27-England | 5 | 1 | 277.00 | 71.38 | 2 |
| 31-South Africa | 3 | 3 | 315.67 | 92.27 | 1 |
| 32-Bangladesh | 2 | 2 | 425.00 | 123.75 | 3 |
| 36-West Indies | 3 | 2 | 387.00 | 109.87 | 3 |
| 37-India | 4 | 0 | 407.50 | 141.15 | 4 |
| 40-South Africa | 3 | 2 | 342.33 | 101.60 | 3 |
| 41-England | 5 | 1 | 351.40 | 94.20 | 5 |
| 44-New Zealand | 2 | 2 | 345.00 | 102.65 | 2 |
| 45-Pakistan | 2 | 1 | 170.50 | 54.80 | 0 |
| 46-India | 2 | 0 | 453.00 | 146.20 | 2 |
| 48-Sri Lanka | 3 | 1 | 333.33 | 107.57 | 3 |
| 49-South Africa | 2 | 1 | 290.00 | 75.70 | 1 |
| 52-West Indies | 3 | 2 | 348.33 | 131.50 | 1 |
| 55-India | 4 | 0 | 321.75 | 117.90 | 1 |
| 56-England | 2 | 0 | 204.00 | 58.90 | 0 |
| Total (Away series) | 87 | 45 | 358 | 105 | 79 |
Bowling wise
| Series wise (1998-2013) | 1st Inn. | Victory | Avg score | Avg overs | 5wi |
| 01-Pakistan | 3 | 1 | 1 | 119.50 | 2 |
| 03-West Indies | 4 | 2 | 2 | 92.25 | 2 |
| 04-Sri Lanka | 3 | 0 | 0 | 64.77 | 1 |
| 05-Zimbabwe | 1 | 1 | 1 | 85.00 | 0 |
| 08- New Zealand | 3 | 3 | 3 | 75.03 | 1 |
| 10-India | 3 | 1 | 1 | 98.13 | 0 |
| 11-England | 5 | 4 | 4 | 78.70 | 5 |
| 14-South Africa | 3 | 2 | 2 | 61.07 | 0 |
| 15-Pakistan | 3 | 3 | 3 | 55.97 | 2 |
| 17-West Indies | 4 | 3 | 3 | 90.78 | 0 |
| 21-Sri Lanka | 3 | 3 | 3 | 108.87 | 2 |
| 23-India | 4 | 2 | 2 | 89.08 | 2 |
| 26-New Zealand | 3 | 2 | 2 | 112.77 | 1 |
| 27-England | 5 | 1 | 1 | 93.78 | 2 |
| 31-South Africa | 3 | 3 | 3 | 83.03 | 2 |
| 32-Bangladesh | 2 | 2 | 2 | 92.25 | 1 |
| 36-West Indies | 3 | 2 | 2 | 90.50 | 1 |
| 37-India | 4 | 0 | 0 | 133.38 | 1 |
| 40-South Africa | 3 | 2 | 2 | 97.57 | 0 |
| 41-England | 5 | 1 | 1 | 85.04 | 1 |
| 44-New Zealand | 2 | 2 | 2 | 61.20 | 1 |
| 45-Pakistan | 2 | 1 | 1 | 52.50 | 2 |
| 46-India | 2 | 0 | 0 | 126.30 | 1 |
| 48-Sri Lanka | 3 | 1 | 1 | 96.03 | 1 |
| 49-South Africa | 2 | 1 | 1 | 47.65 | 1 |
| 52-West Indies | 3 | 2 | 2 | 114.87 | 1 |
| 55-India | 4 | 0 | 0 | 127.68 | 3 |
| 56-England | 2 | 0 | 0 | 79.55 | 2 |
| 87 | 299.80 | 91.48 | 38 |
Now to end, a brief look at away performance of all teams in last two years. Below table also includes how many times teams scored >400 in 1st inn batting, and conceded < 300 1st inn bowling.
| 2011-2013 | Tests | Won (%) | >400 | <300 | Won in |
| Pakistan | 13 | 5 (38.50%) | 4 | 4 | Ban (2)SL (1) , WI(1) ZIM(1) |
| Australia | 14 | 4 (28.60%) | 4 | 8 | SL(1) SA(1) WI(2) |
| England | 10 | 4 (40.00%) | 7 | 3 | AUS (1) SL(1) IND(2) |
| South Africa | 9 | 4(44.44%) | 6 | 4 | NZ(1) ENG(2) AUS(1) |
| New Zealand | 13 | 3(23.10%) | 2 | 5 | ZIM (1), AUS(1), SL (1) |
| West Indies | 10 | 3 (30.00%) | 5 | 3 | BANG(3) |
| Bangladesh | 5 | 1 (20.00%) | 1 | 1 | ZIM(1) |
| India | 12 | 1 (8.33%) | 1 | 4 | WI(1) |
| Sri Lanka | 9 | 1 (11.10%) | 2 | 1 | SA(1) |
| Zimbabwe | 3 | 0 (0.00%) | 0 | 0 | None |
Not surprisingly India has won only 1 Test in 12 games away from home. Perhaps Dhoni and Indian selectors need to look at type of pitches they prepare at home, and if they are able to come close to what they would get when they travel than chances of winning overseas might improve.
All data is updated/processed after the 2nd Test match @ Lord’s.
