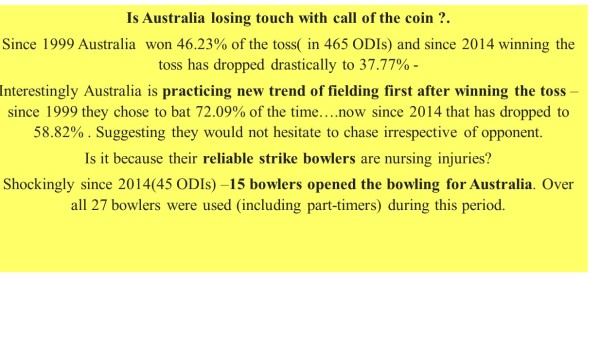
Australia’s bowling dilemma – their predicament in ODI is lack of strike bowlers, and in last few games they are trying various players to open the bowling in limited overs cricket.
Keeping that in mind, I looked at their bowling figures in various stage of 10 over phase while defending(2nd bowling) since WCUP2015, and compare their run-rate with team’s required run-rate.
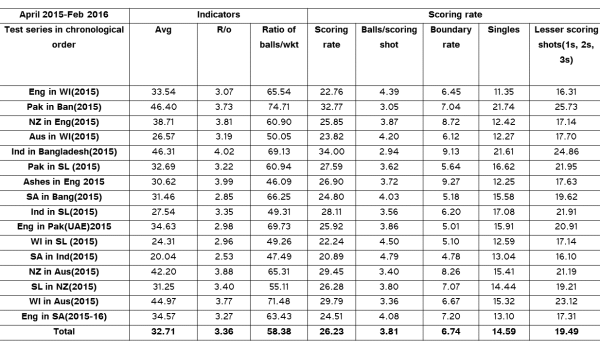
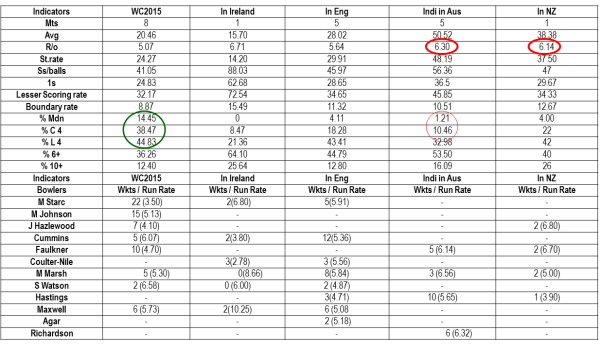
Since WCUP-2015 six times Australia batted first, won 4 games and lost 2. Apart from Ireland match(rain reduced to 40-over game), they manage to set 300 or more score in all games for their opponent to chase.
Here is how they performed. In below stats display I have only selected bowlers who are currently playing in the ongoing Chappell-Hadlee Trophy in New Zealand.
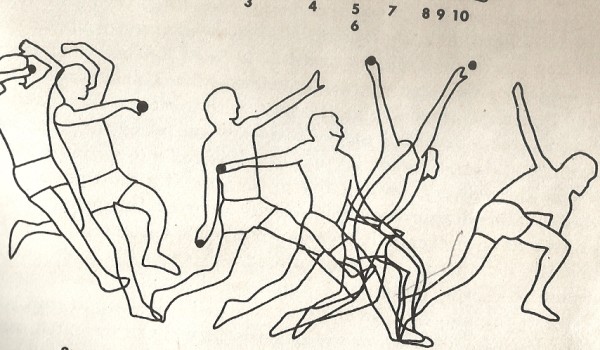
Here is graphic display of their bowling performance against RRR.
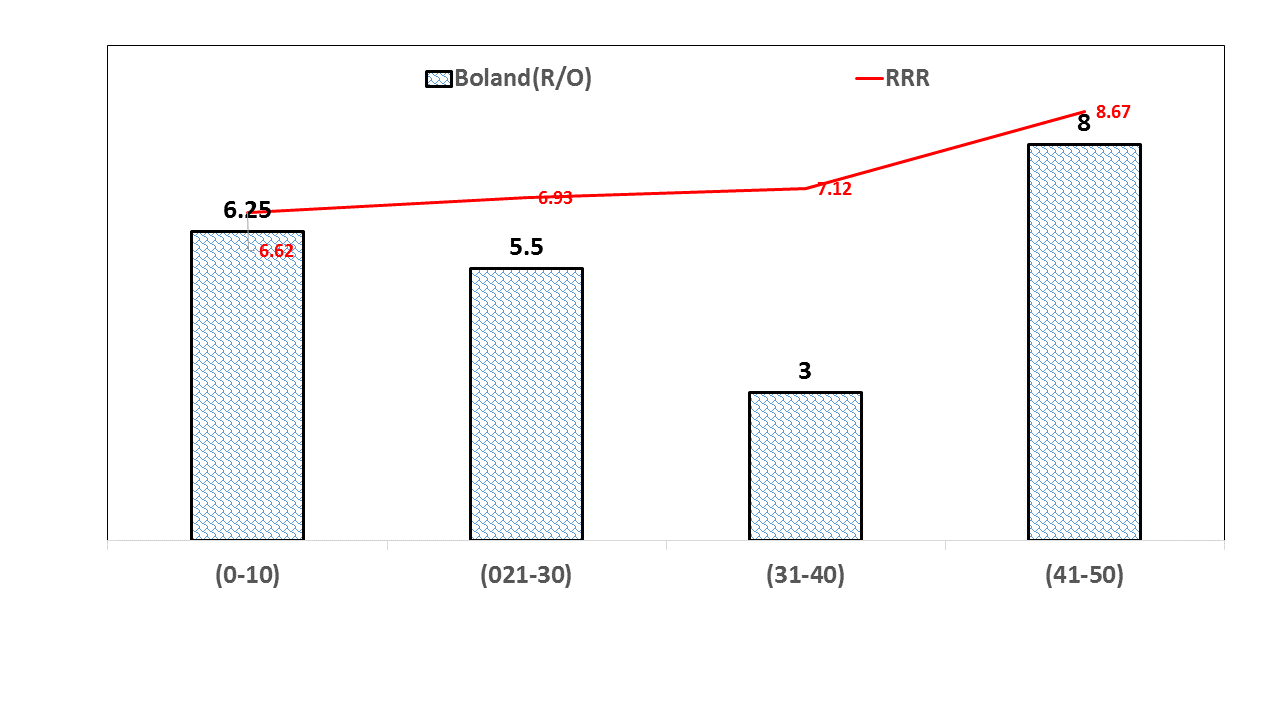

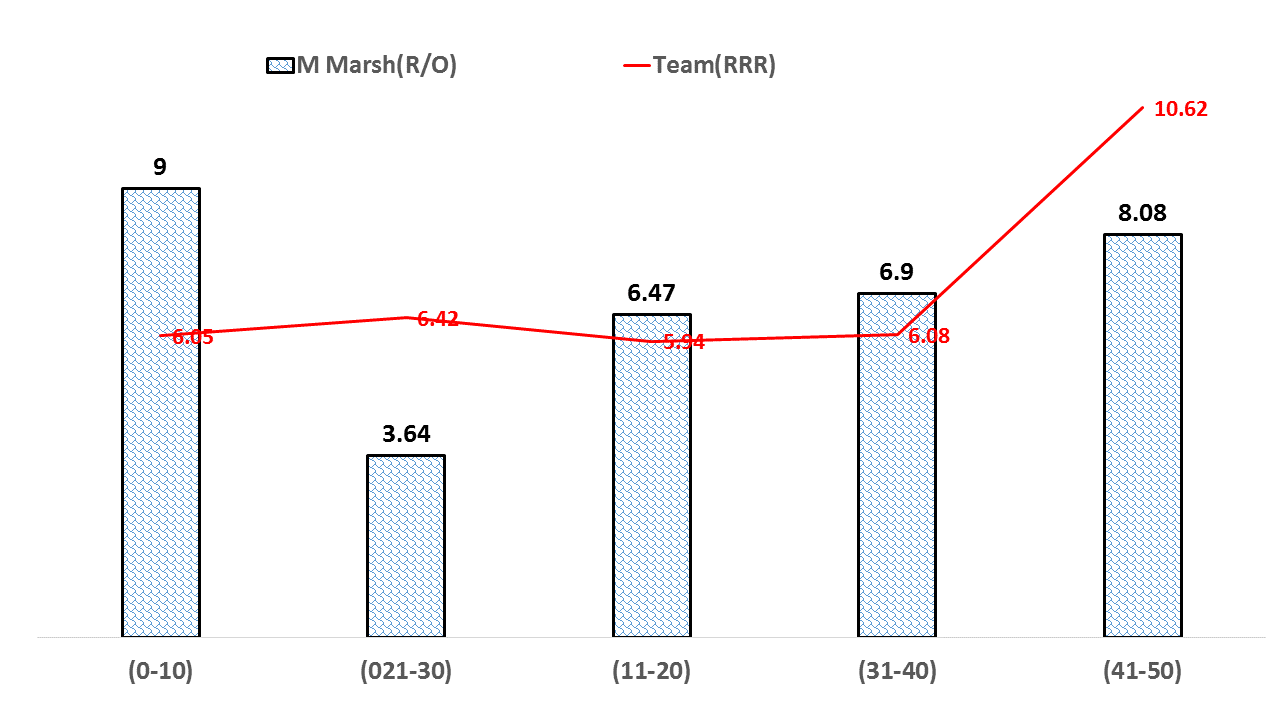
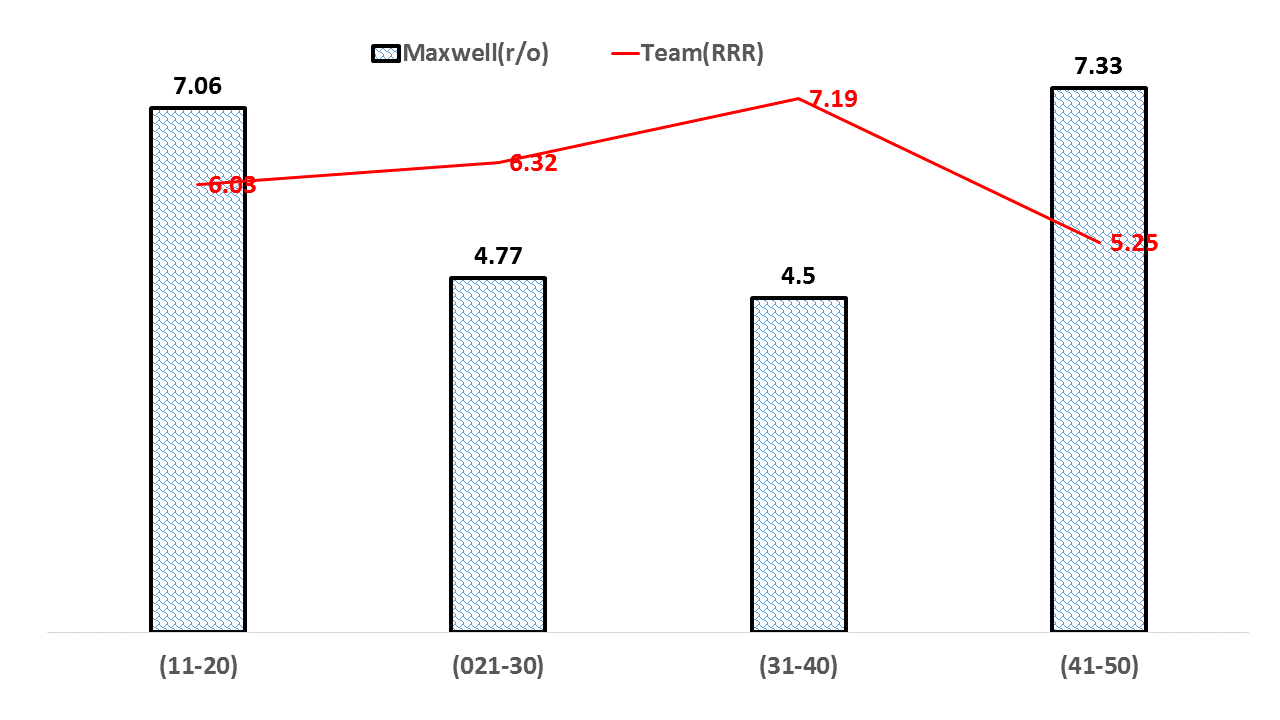
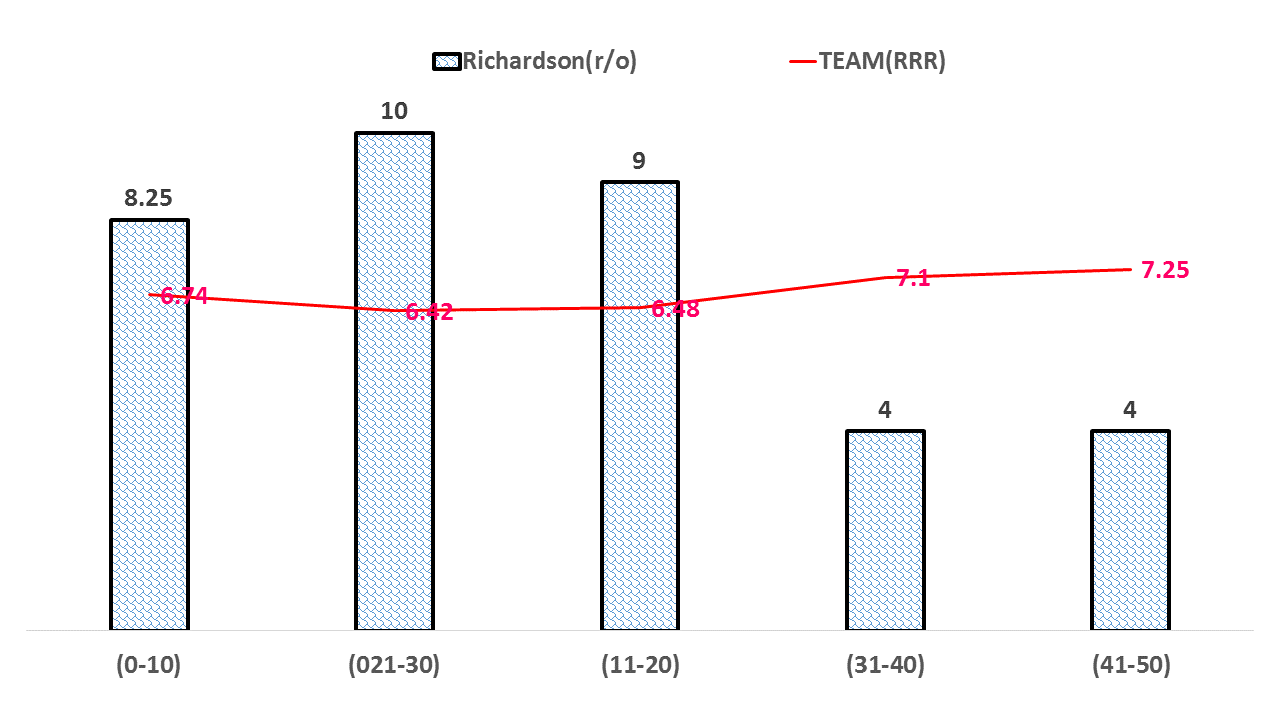
Here is the detailed bowling analysis in table format. The second column is the team’s asking rate- which is followed by bowler’s analysis in each phase while defending.
| Bowlers in each phase |
Team’s(RRR) |
Balls |
Runs |
Wk |
r/o |
ss/balls |
4s |
1s |
lesser s.s |
| Boland |
6.62 |
60 |
58 |
0 |
5.80 |
53.33 |
10.00 |
33.33 |
43.33 |
| (0-10) |
6.62 |
24 |
25 |
0 |
6.25 |
45.83 |
16.67 |
20.83 |
29.17 |
| (021-30) |
6.93 |
12 |
11 |
0 |
5.50 |
41.67 |
8.33 |
25.00 |
33.33 |
| (31-40) |
7.12 |
12 |
6 |
0 |
3.00 |
50.00 |
0.00 |
50.00 |
50.00 |
| (41-50) |
8.67 |
12 |
16 |
0 |
8.00 |
83.33 |
8.33 |
50.00 |
75.00 |
| Faulkner |
6.32 |
103 |
105 |
0 |
6.12 |
58.25 |
8.74 |
37.86 |
49.51 |
| (0-10) |
6.49 |
12 |
13 |
0 |
6.50 |
58.33 |
16.67 |
41.67 |
41.67 |
| (021-30) |
6.32 |
24 |
27 |
0 |
6.75 |
66.67 |
8.33 |
45.83 |
58.33 |
| (11-20) |
6.57 |
24 |
28 |
0 |
7.00 |
58.33 |
16.67 |
33.33 |
41.67 |
| (31-40) |
6.76 |
6 |
5 |
0 |
5.00 |
66.67 |
0.00 |
50.00 |
66.67 |
| (41-50) |
8.20 |
37 |
32 |
0 |
5.19 |
51.35 |
2.70 |
32.43 |
48.65 |
| Hastings |
5.75 |
162 |
167 |
5 |
6.19 |
51.23 |
11.73 |
30.25 |
39.51 |
| (0-10) |
5.75 |
61 |
65 |
0 |
6.39 |
49.18 |
14.75 |
26.23 |
34.43 |
| (021-30) |
6.05 |
24 |
14 |
1 |
3.50 |
41.67 |
4.17 |
33.33 |
37.50 |
| (11-20) |
5.84 |
20 |
20 |
1 |
6.00 |
45.00 |
10.00 |
30.00 |
35.00 |
| (31-40) |
6.06 |
55 |
61 |
3 |
6.65 |
58.18 |
10.91 |
32.73 |
47.27 |
| (41-50) |
12.00 |
2 |
7 |
0 |
21.00 |
100.00 |
50.00 |
50.00 |
50.00 |
| M Marsh |
5.94 |
271 |
301 |
7 |
6.66 |
57.93 |
11.44 |
37.27 |
46.49 |
| (0-10) |
6.05 |
30 |
45 |
0 |
9.00 |
56.67 |
23.33 |
26.67 |
33.33 |
| (021-30) |
6.42 |
33 |
20 |
1 |
3.64 |
45.45 |
0.00 |
42.42 |
45.45 |
| (11-20) |
5.94 |
115 |
124 |
2 |
6.47 |
61.74 |
9.57 |
41.74 |
52.17 |
| (31-40) |
6.08 |
67 |
77 |
1 |
6.90 |
58.21 |
13.43 |
35.82 |
44.78 |
| (41-50) |
10.62 |
26 |
35 |
3 |
8.08 |
57.69 |
15.38 |
26.92 |
42.31 |
| Maxwell |
5.25 |
189 |
180 |
6 |
5.71 |
56.61 |
7.41 |
41.27 |
49.21 |
| (021-30) |
6.32 |
73 |
58 |
1 |
4.77 |
53.42 |
5.48 |
43.84 |
47.95 |
| (11-20) |
6.03 |
62 |
73 |
3 |
7.06 |
66.13 |
8.06 |
41.94 |
58.06 |
| (31-40) |
7.19 |
36 |
27 |
1 |
4.50 |
47.22 |
5.56 |
36.11 |
41.67 |
| (41-50) |
5.25 |
18 |
22 |
1 |
7.33 |
55.56 |
16.67 |
38.89 |
38.89 |
| Richardson |
6.42 |
60 |
68 |
5 |
6.80 |
43.33 |
15.00 |
15.00 |
28.33 |
| (0-10) |
6.74 |
24 |
33 |
1 |
8.25 |
41.67 |
20.83 |
16.67 |
20.83 |
| (021-30) |
6.42 |
6 |
10 |
0 |
10.00 |
50.00 |
33.33 |
0.00 |
16.67 |
| (11-20) |
6.48 |
6 |
9 |
0 |
9.00 |
66.67 |
16.67 |
16.67 |
50.00 |
| (31-40) |
7.10 |
6 |
4 |
1 |
4.00 |
50.00 |
0.00 |
33.33 |
50.00 |
| (41-50) |
7.25 |
18 |
12 |
3 |
4.00 |
33.33 |
5.56 |
11.11 |
27.78 |
| S Smith |
6.21 |
24 |
36 |
0 |
9.00 |
75.00 |
25.00 |
50.00 |
50.00 |
| (021-30) |
6.21 |
18 |
24 |
0 |
8.00 |
66.67 |
22.22 |
44.44 |
44.44 |
| (31-40) |
6.78 |
6 |
12 |
0 |
12.00 |
100.00 |
33.33 |
66.67 |
66.67 |
| Stoinis |
6.64 |
24 |
17 |
0 |
4.25 |
45.83 |
8.33 |
37.50 |
37.50 |
| (021-30) |
6.64 |
24 |
17 |
0 |
4.25 |
45.83 |
8.33 |
37.50 |
37.50 |
All data is updated at end of 1st ODI –Chappell-Hadlee Trophy