In a cricket match Bowlers have more privilege than batsman. The major reason is that batsman cannot bat in spells irrespective format/surface and level.
If a batsman is in poor form, can he chose to retire and resume his inning later?. The answer is No, but bowlers can. If a bowler is having a bad spell than he can either change ends, or bowl after some time. Hence they are more privileged than batsmen.
Yes, bowlers have been badly treated since the grounds man(mali) has taken to doping(doctoring) the pitches. However that should not rob the bowlers of his skill of taking wickets, because as a bowler he has modelled his skills on pitches that he has trained and learned.
If he is born in Asia, he would be bowling on pitches that has low bounce and slow off the wicket, and vice versa in countries like Australia, England, South Africa, New Zealand, and bit of West Indies. E.g Asian captains won’t prepare pitches that has grass, irrespective of quality of fast bowlers in their arsenal(Pakistan had great fast bowlers) but its their batsman that needs protection hence it is prepared to suit them. I guess same is the case in all countries!.
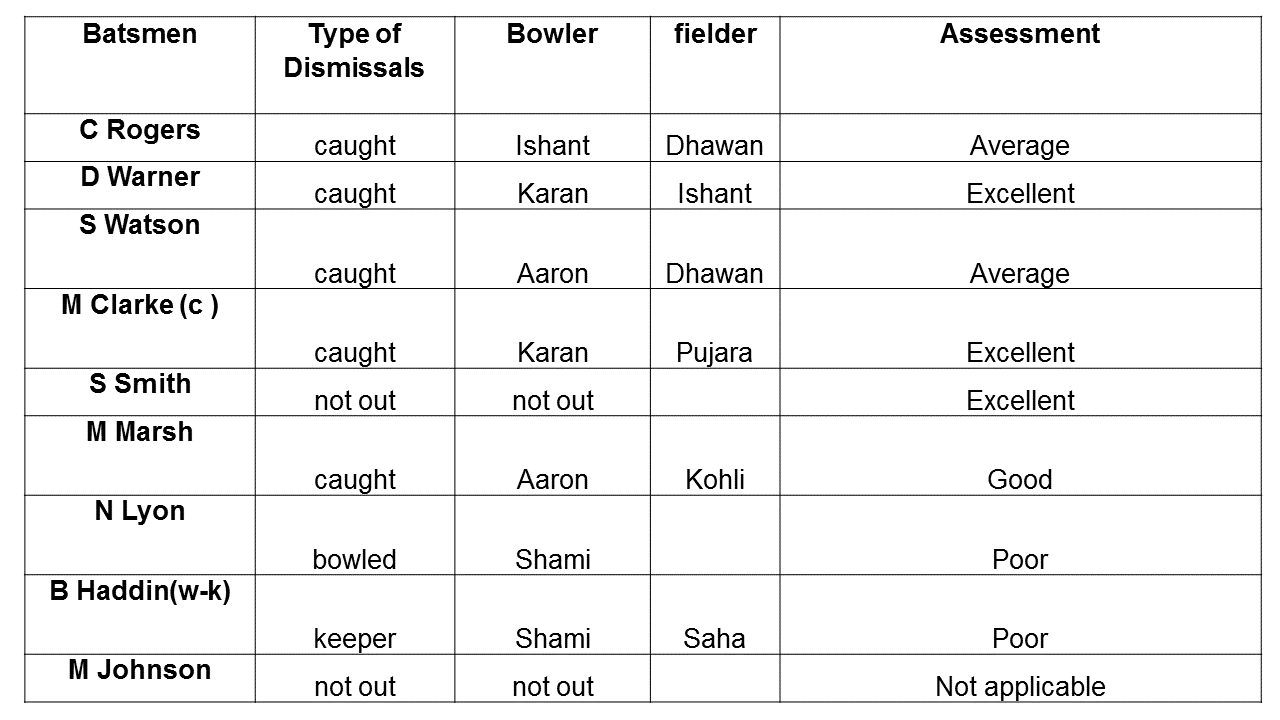
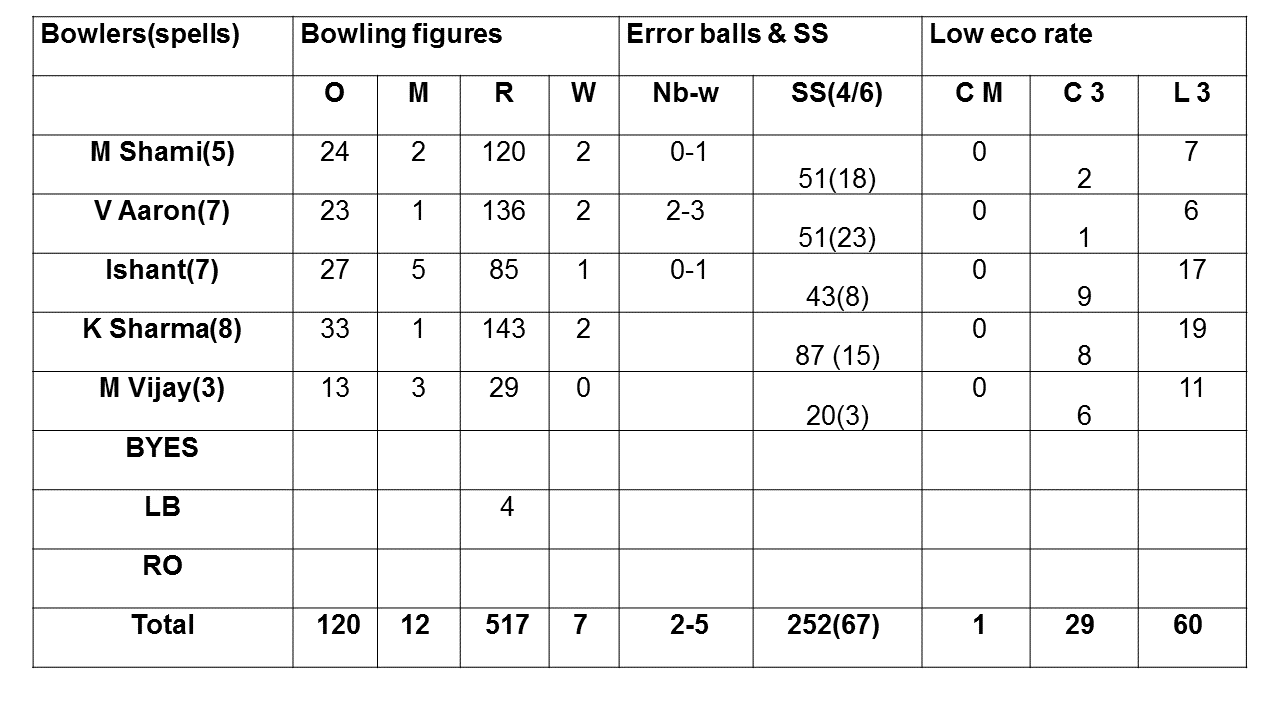
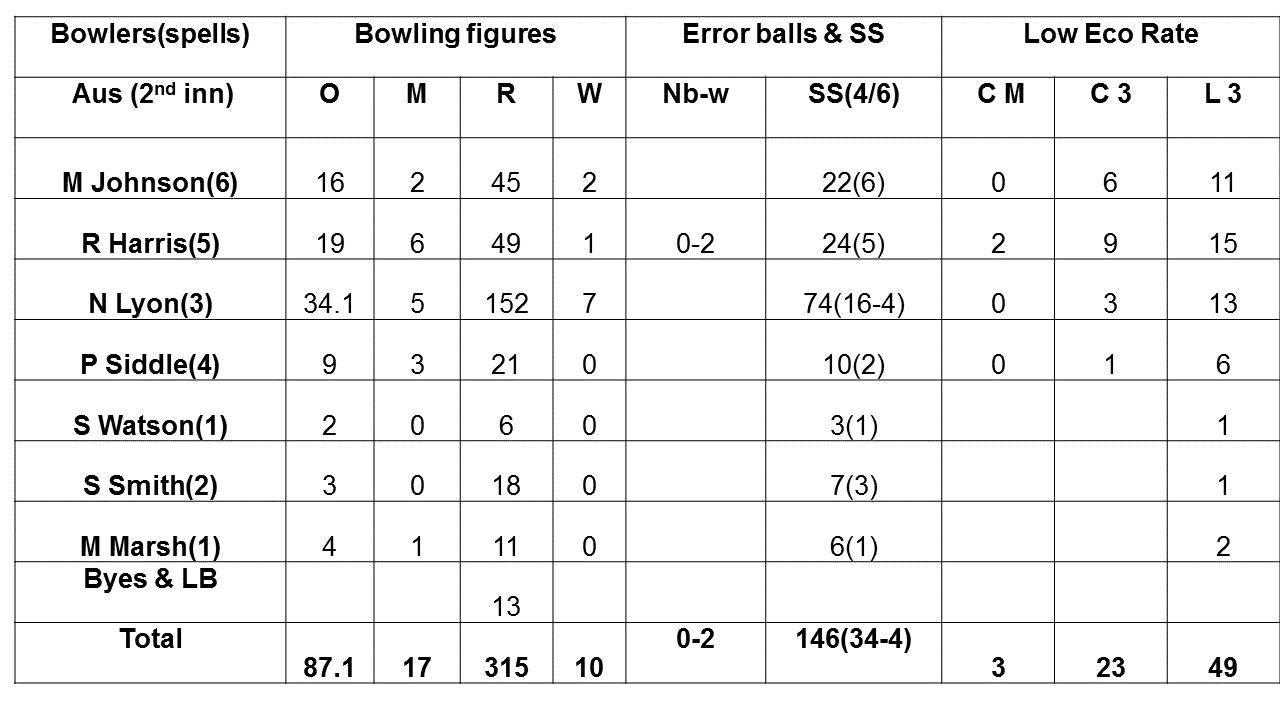
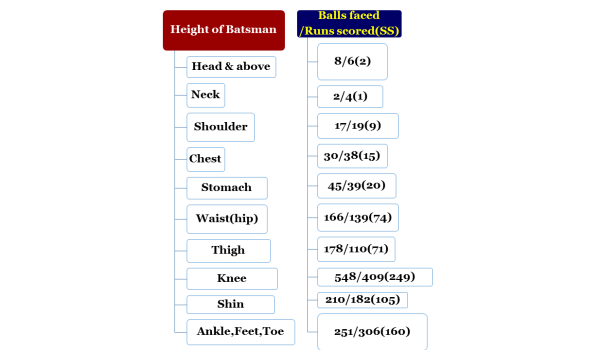
However statistically, almost 15.00% of runs come from “inaccurate shot” selection,viz underedge, mistimed, miscued, unintentional shots. The same goes for bowler’s ability to pick wickets, almost 15.00% of dismissals are from reckless shots played by batsmen, and its constantly increasing. Nevertheless one might feel this is due to advent of T20, but its not the case. The shorter the format makes it more viable for the game to grow.
Here are few pointers for Batsman and Bowlers.
What batsman can do:
- Can bat inside or outside the crease, and stand in any line, outside off or outside leg.
- They can switch hands and play shots without telling the umpire.
- They can bat till end of an innings.
- Can use a runner only if he gets injured in ongoing game. In middle of an over a bowler can be replaced if he is injured or reported for illegal/unsporting bowling.
- Use all the protection against bowling. Pads, gloves, helmets, guards, glares. They only can use sweat band/cloth material and body fluid to shin the ball.
- They can pause a game if there is a disturbance behind site screen or in the ground. Bowlers can do the same.
- In the middle of an innings he can change his bats,gloves,pads, or anything they are wearing. Bowlers can do the same, viz change his gears.
- They can ask the umpires to remove obstacles object from bowler’s attire, and also intervene the game if a fielder becomes an obstacle.
- He can only retire if he is physically injured or exhausted or if the inning is declared.
What Batsman cannot do:
- cannot bat in spells
- cannot chose bowlers to bat
- cannot change batting ends. If a batsman has to save his batting partner from getting dismissed, than he has to take a run from the last ball, so that he can have the strike in next over.
- cannot change the ball unless its completey torn .
- cannot take advantage of the surface, but Asian teams prepare pitches to suit their batsmen, which eventually suits their bowlers too!.
- cannot change the field setting
What bowlers can do:
- They can bowl in spells at any time of an inning or day or session.
- They can chose to bowl to any batsman they want.
- In Test matches they can bowl innumerable overs.
- They can take advantage of surface and weather. Host teams prepare surface that majorly suits their batsman and eventually their bowlers(one type or both at times).
- They can change the ball if it has gone out of shape or size, or torn/worn out.
- They can tell the umpire to stand deep or close to stumps.
- They can chose which end of the ground and pitch(over the wicket or round the wicket) they want to bowl.
- They can change the field and use them anywhere, close or deep. Almost 15.00% of their wickets are from loose shots played by batsmen (its constantly increasing since the advent of T20).
What bowlers cannot do:
- Hit batsman intentionally.
- Bend their arm while bowling.
- cannot follow through on playing area of the pitch.
- cannot tell a batsman to change gear(including bat, glove, pad).