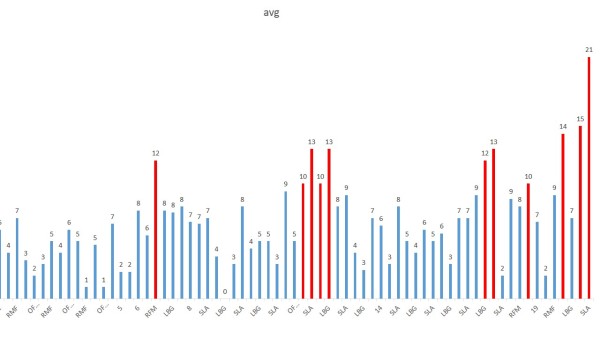
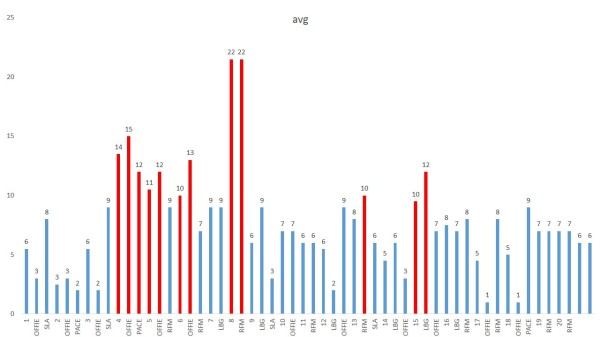
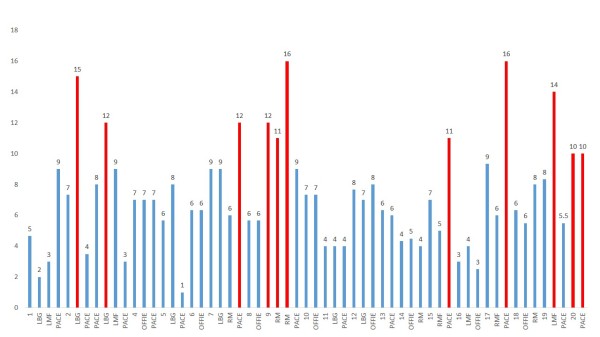
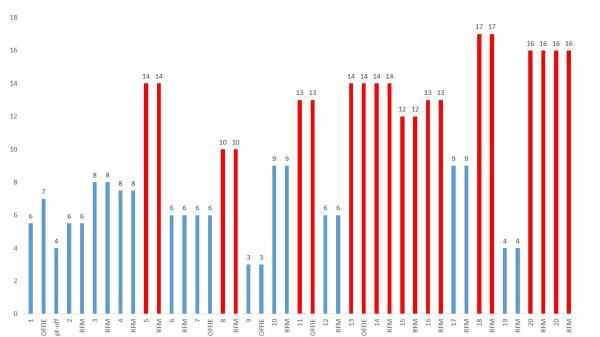
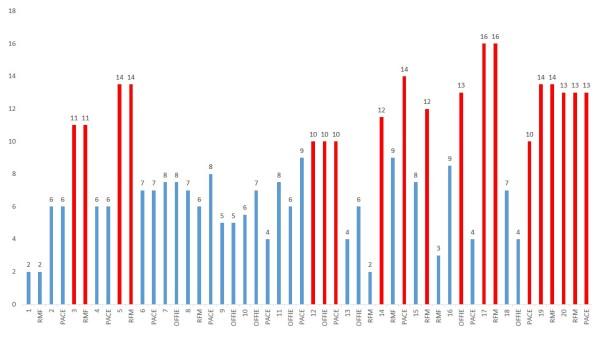
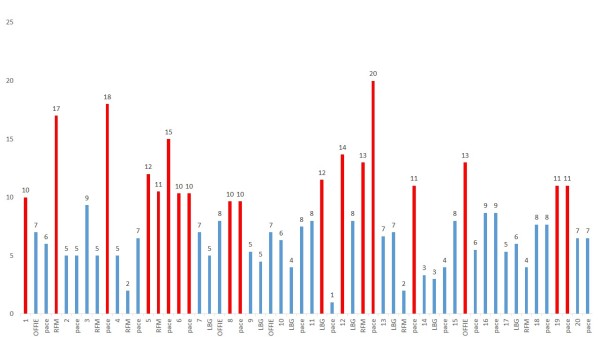
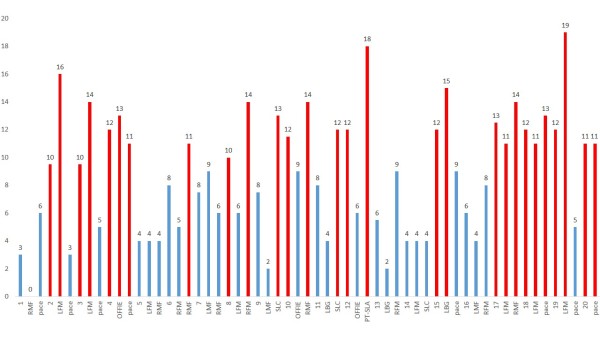
Bowling efficiency in this T20WC2014. Here is average runs conceded by teams . All data since game 13(Ind – Pak) to 24 (Aus – WI). Bowling type is mentioned along with over# at the bottom line.
Red color in the column bar indicates > 10 runs /over (avg) conceded. Hope am not harsh on bowlers, after all its T20, no room for tiniest of error. Every error gives reason for defeat!.
Here is a thought, if ICC can have a mandatory dimension boundaries of say 70 yards perimeter, than there would be more opportunity for fielders to take catches, which right now when mistimed, top edge, miscued, or mishit, they don’t fall inside the current perimeter of these grounds. It would be fair for host and visiting teams.
GFX 1 : India bowling performance.
GFX 2 – Pakistan bowling performance
GFX 3- Sri Lanka bowling performance. 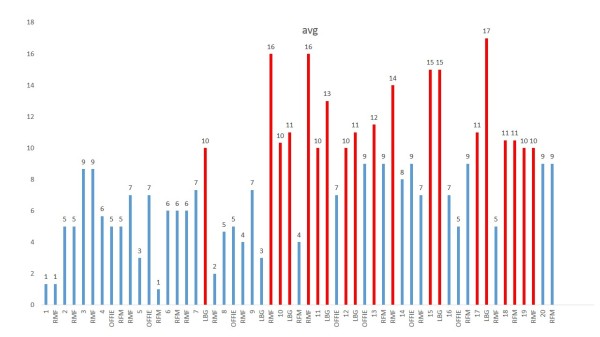
GFX 4 – West Indies Bowling Performance
GFX 5 – England Bowling Performance
GFX 6 – New Zealand Bowling Performance
GFX 7 – South Africa Bowling Performance
GFX 8- Australia’s Bowling Performance

