Here is second part of previous post https://bit.ly/2JvmebT
Since Australia’s ODI tour in SA they conceded 5.78 R/o in 29 games.

Hence let us look how consistent they were with C 4 (consecutive overs that went for 4 or less runs), and compare it with C 6 (consecutive overs that went for 6 or more runs).
Australia's Bowling Rate
Interestingly there is drop in C 4 and constant rise in C 6. Let us look at series-wise table of the above 2 indicators.
Below analysis displays phase wise performance and first 2 balls and last 2 balls of an over.
 |
| The C 6 "trigger-rise" happened in South Africa in 2016, and then it continued regularly reaching 23% in their last series. |
| On the other hand C 4 has been dropping and now hovering in the 20% |
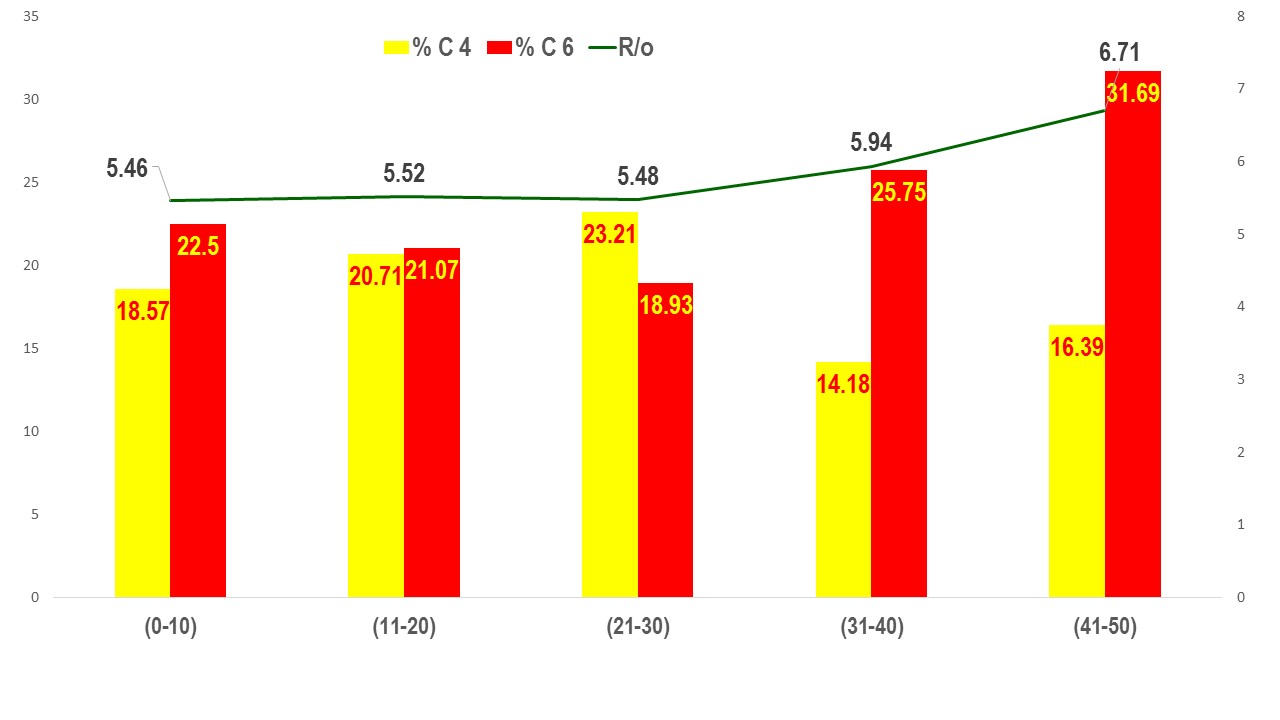
| Let us look at how run rate progressed in each phase of a match. Below table and gfx is comparison of C 4 v C 6 in each phase against Run rate |
 |
| From the above gfx it clearly indicates rise in C 6 from beginning of the innings. Every 4 overs you would get back to back 6.00 R/o!!. |
| Below table is summary analysis of each phase(both inns)across primary indicators. |
 |
| As we can clearly see progress of C 6 and C 10 |
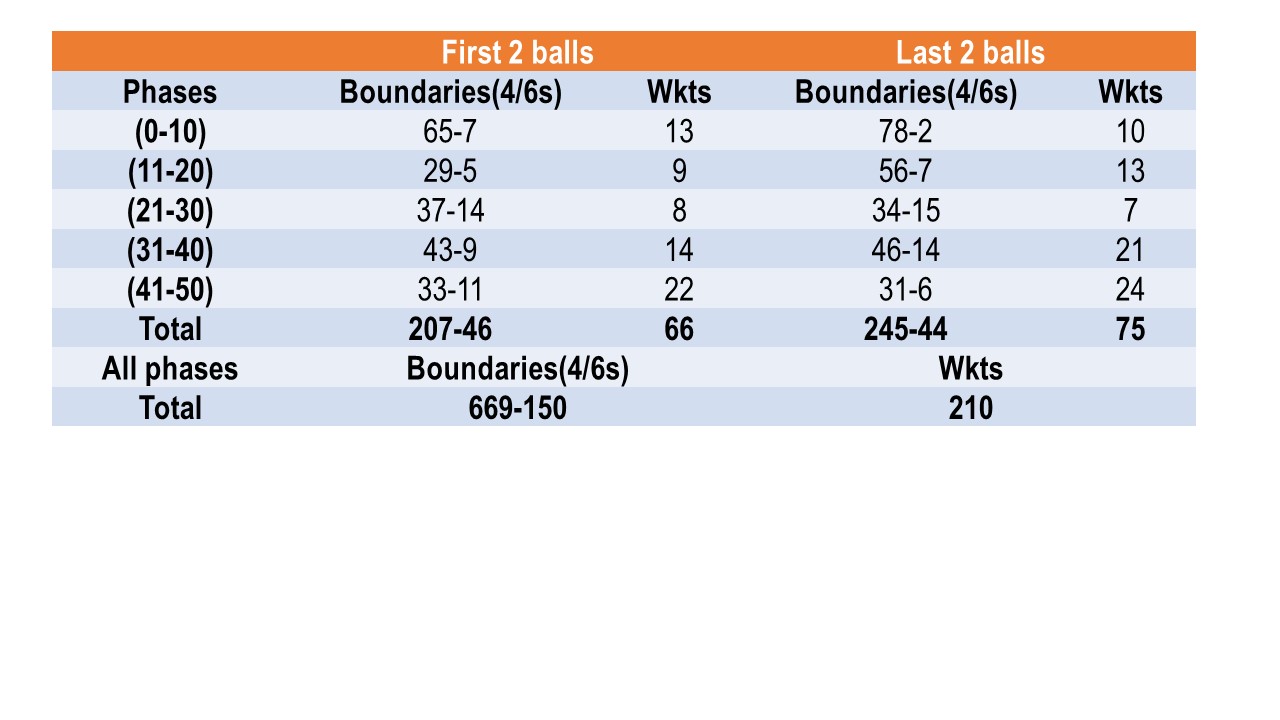
| Below is raw data on No. wkts and boundaries in first 2 balls and last 2 balls of an over |
 |
| In all phases the first 2 balls produced 30.89% boundaries, and 31.42% wkts |
| In all phases the last 2 balls produced 35.28% boundaries, and 35.70% wkts |
These indicators (C 6, C 10, C 4)includes extras conceded by Australian bowlers.


