Test series – Border Gavaskar series.
End of 2nd Test, Australians have scored 933 runs in 340.1 overs, and lost 40 wickets. Their run rate is low at 2.74 and strike rate is 51(balls per wicket)although if one has to omit their last outing than it is 61 balls/wkt which is reasonably healthy considering the type of pitches they are playing. Interestingly their batsmen faced more overs (100+)than India in 2 tests played.
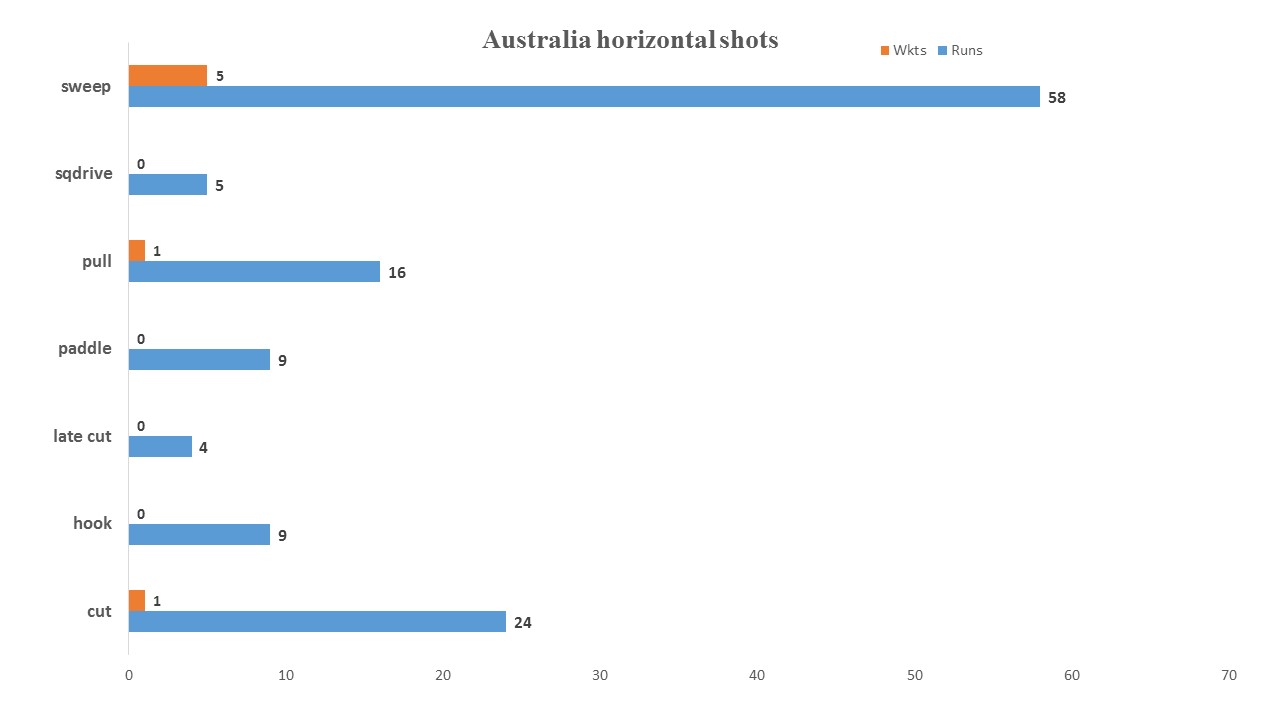
Visiting batsmen touring India tend to lose their wickets playing horizontal shots(particularly against spin), and so far Australia lost very few (7).
Below is Australia’s analysis of horizontal and vertical shots played in these 2 games.
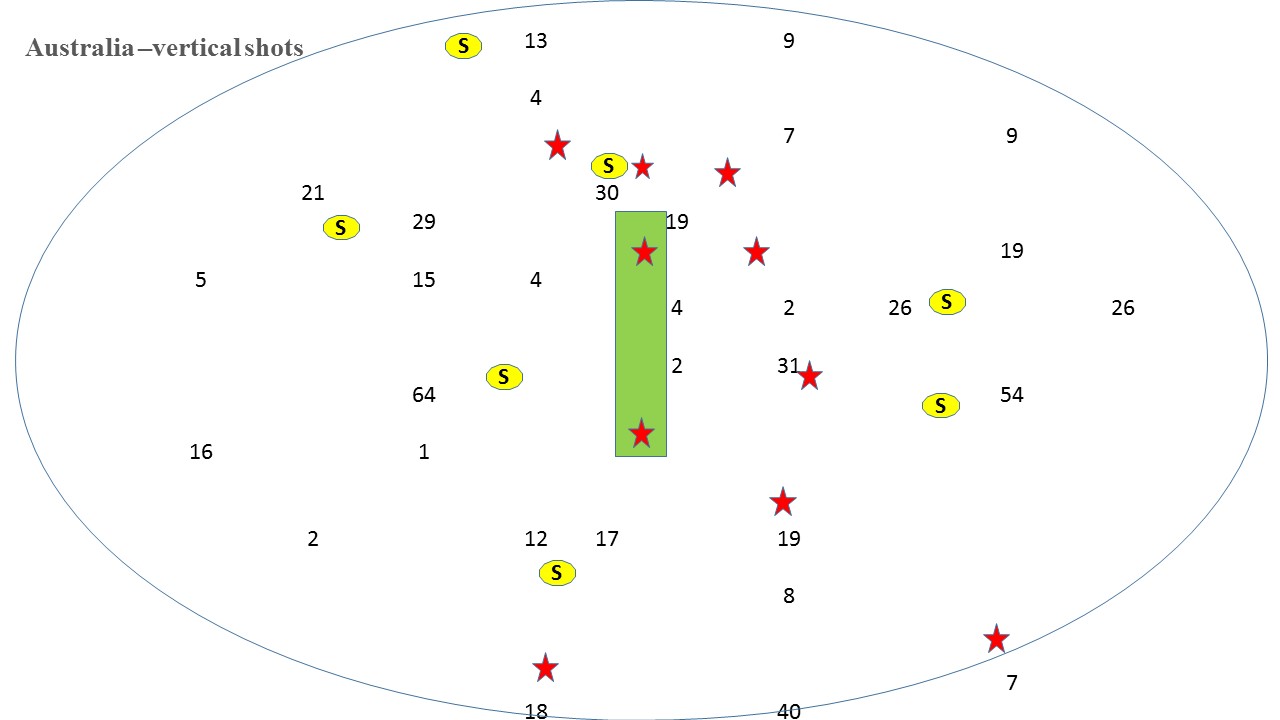
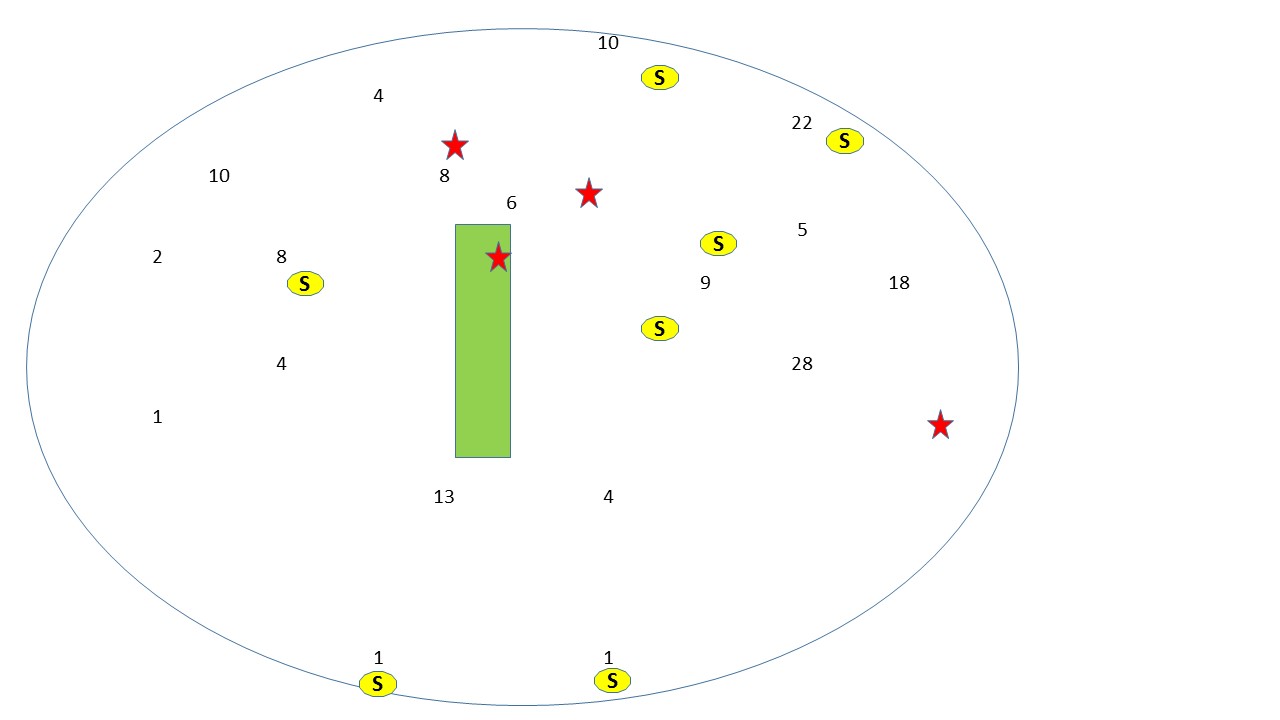
Australia scoring zone while playing horizontal and vertical shots
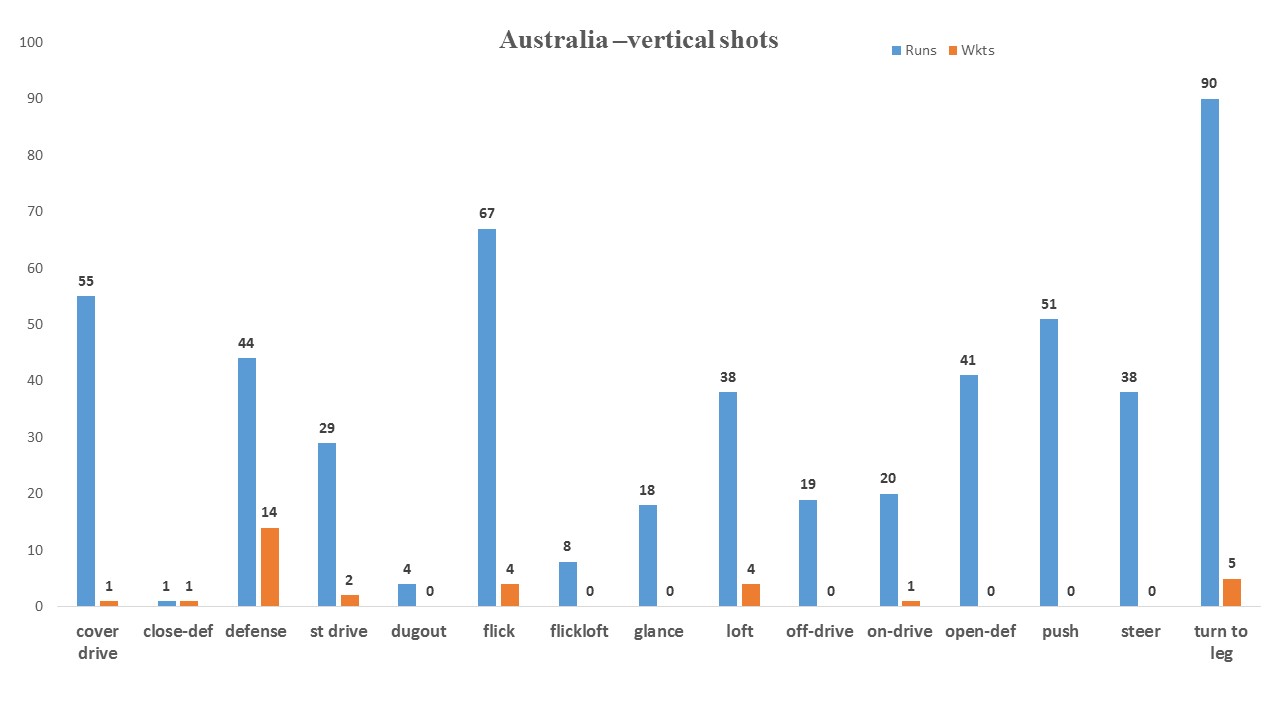
40 wickets in 2 Tests - The horizontal shot claimed only 7 wickets(5 got out trying to sweep, one each to cut and pull shot). The vertical shot fetched maximum runs(523) as well wickets(33)| The vertical shot analysis. Below gfx displays runs/wkt. |
|---|
 |
| Below gfx displays runs scored(while playing vertical shots)in each zone of the field. The red mark is where Australia lost their wickets(LBW, BOWLED is displayed in green zone,viz pitch),and the yellow mark is potential runs saved by Indian fielders |
 |
| The horizontal shot analysis. Below gfx displays runs/wkt. |
 |
| Below gfx displays runs scored(while playing horizontal shots) in each zone of the field. The red mark is where Australia lost their wickets(LBW, BOWLED is displayed in green zone,viz pitch),and the yellow mark is potential runs saved by Indian fielders |
 |
Note – I was not able to record some part of these 2 tests, hence the above gfx displays only 75 % of H V shots. The runs which are not recorded is not used for this analysis.

