Before the finals the average first bat score is 166 – but the win factor is slightly more at 177.
And how many times teams have successfully chased down that target? –Just 5 out of 21 times(>177 target).
Suggesting irrespective of what the situation and circumstances, it is always difficult to chase(23.80%) down big score(average win score this year). Therefore first batting is always a better option, as there is less pressure when you scoring runs.
Here is a statistical analysis of win factor across all indices.
| Win factor | Bat | Bowl |
| Avg | 35.60 | 20.78 |
| r/o | 8.90 | 7.71 |
| b/w | 24.00 | 16.01 |
| Scoring rate | 64.70 | 59.44 |
| Boundary rate | 19.10 | 15.73 |
| Mdn | 0.37 | 0.70 |
| % C 5 | 3.63 | 7.07 |
| % L 5 | 13.54 | 17.83 |
| % 6+ | 34.53 | 30.86 |
| %10+ | 18.43 | 14.38 |
Phases
| Powerplay | Bat | Bowl |
| Avg | 49.00 | 23 |
| r/o | 8.27 | 7.05 |
| b/w | 35.60 | 19.60 |
| Scoring rate | 51.3 | 47.4 |
| Boundary rate | 21 | 17.3 |
| Mdn | 1.88 | 3.75 |
| % C 5 | ||
| % L 5 | 33.1 | 40.6 |
| % 6+ | 66.9 | 59.7 |
| %10+ | 33.8 | 23.7 |
| 7-10 | Bat | Bowl |
| Avg | 33.90 | 25.40 |
| r/o | 7.82 | 7.17 |
| b/w | 26 | 21.2 |
| Scoring rate | 65.7 | 62.5 |
| Boundary rate | 14.10 | 12.2 |
| Mdn | 0.44 | 0.87 |
| % C 5 | ||
| % L 5 | 32.8 | 41.7 |
| % 6+ | 67.4 | 58.3 |
| %10+ | 29.7 | 24.3 |
| 11-15 | Bat | Bowl |
| Avg | 35.70 | 25.20 |
| r/o | 8.59 | 7.83 |
| b/w | 24.90 | 19.3 |
| Scoring rate | 68.4 | 65.6 |
| Boundary rate | 16.6 | 13.9 |
| Mdn | 0.39 | 0 |
| % C 5 | ||
| % L 5 | 27.2 | 38.6 |
| % 6+ | 73 | 61.7 |
| %10+ | 35.7 | 28.3 |
| 16-20 | Bat | Bowl |
| Avg | 24.6 | 17.20 |
| r/o | 13.4 | 9.71 |
| b/w | 13.40 | 10.6 |
| Scoring rate | 75.8 | 69.1 |
| Boundary rate | 23.6 | 19.7 |
| Mdn | 0 | 0.41 |
| % C 5 | ||
| % L 5 | 18.5 | 24.8 |
| % 6+ | 84.9 | 75.5 |
| %10+ | 58.2 | 43.7 |
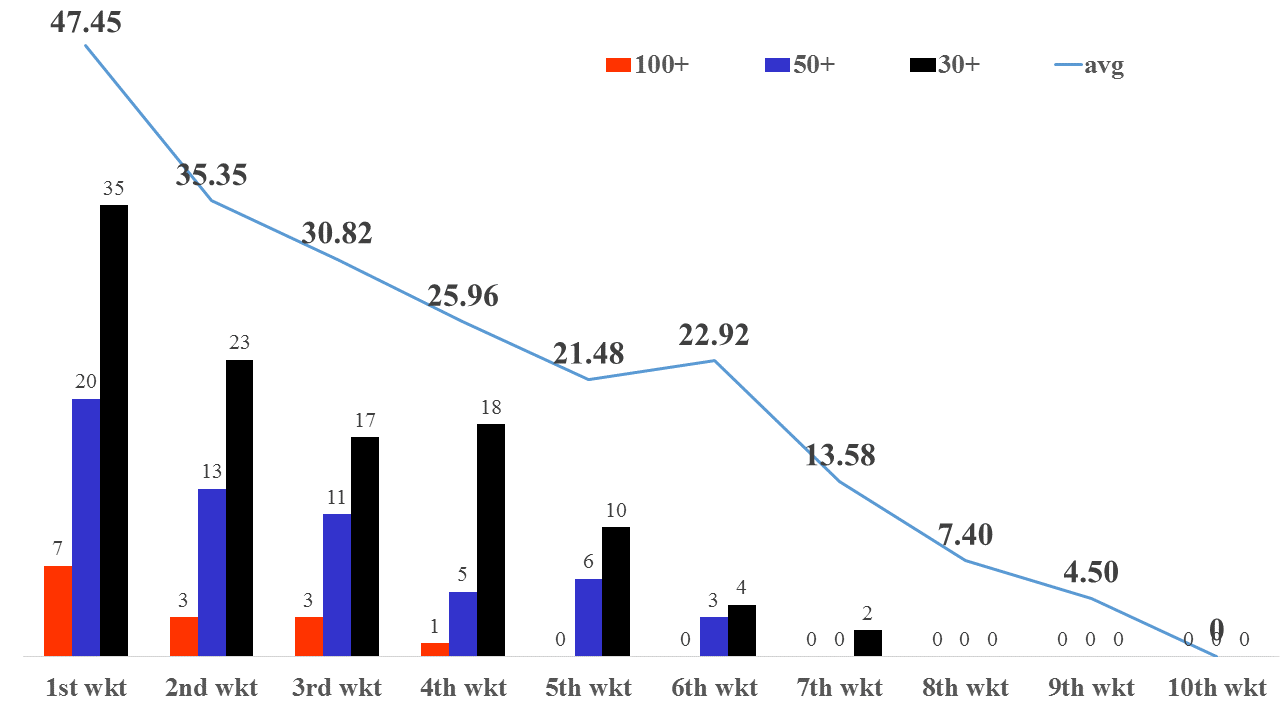
Partnerships
Below graph clearly suggests when teams win matches there is a huge mass of runs at the top. The batting average and partnerships list of 100+, 50+, 30+ reflects.
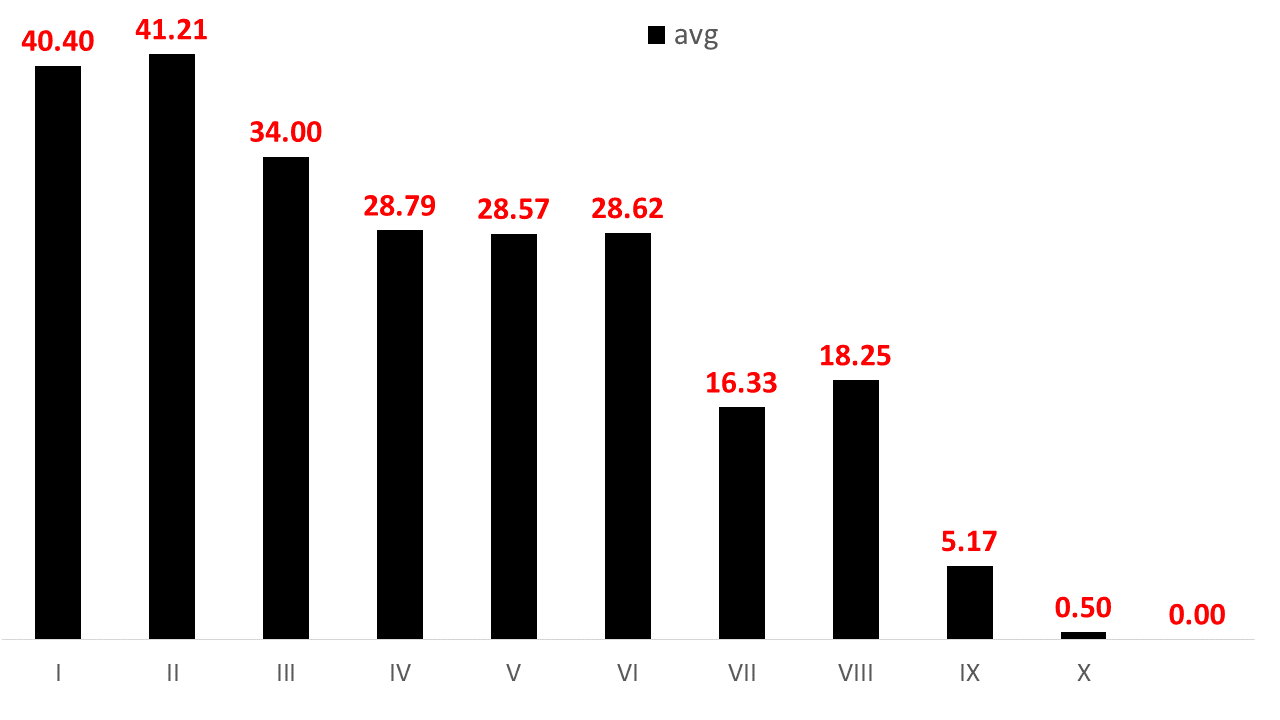
Batting Order
From partnership we recognise when winning (especially)the bulk of runs are scored from top order. Now the batting order comprehends that heavy contribution from top and middle order.
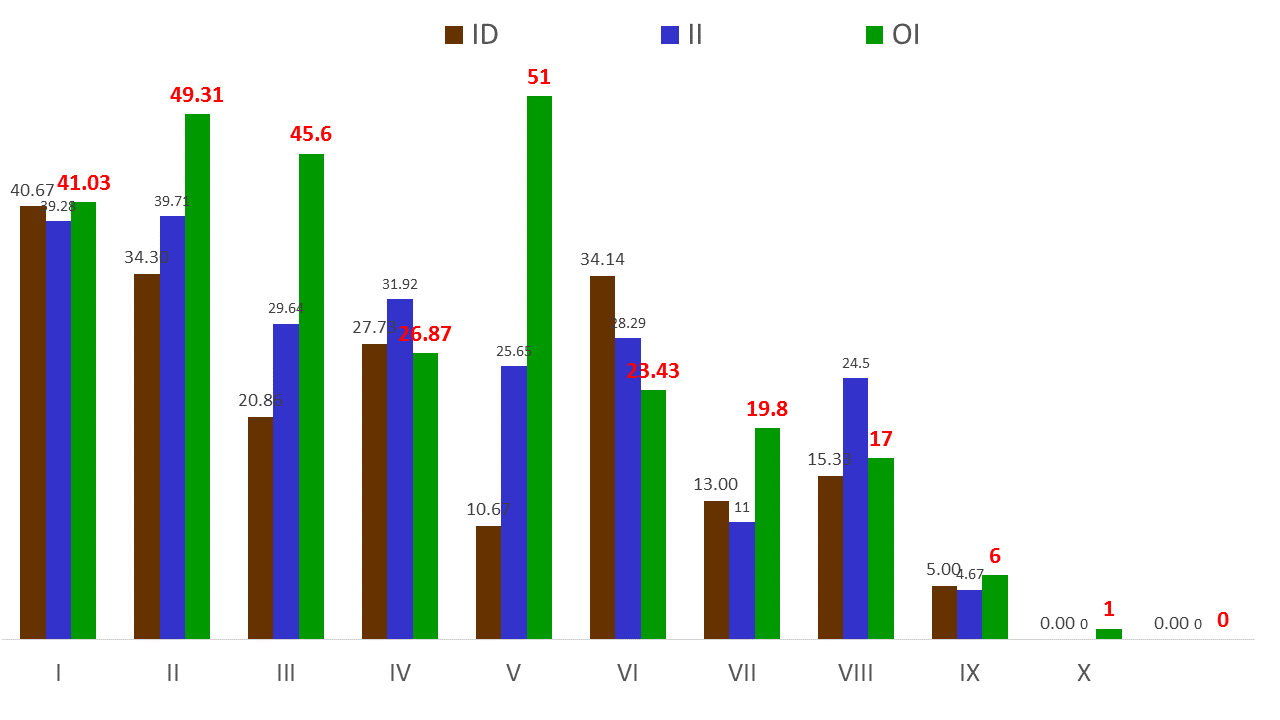
There are two graphs based on batting order
a) shows batting average in win situation for each batting order
b) shows contribution from overseas players and Indian batsmen(domestic and Indian). It clearly shows overseas batsmen have best batting average.
links to all the stats indicators http://allthatcricket.com/?p=1489
