Summary
In this WC 2015, India have won all its 7 games, and Australia have won 5, losing and abandoning one.
India :
Batting: Tried to saved their wickets at the top, and not lost any between 30-40 overs. They used the powerplays to score maximum boundaries.
Bowling: Their bowlers have done exceptionally well, especially in the first 10 overs, conceding less 4 runs/over.
They have used their spinners to arrest boundaries and reduce run rate.
Australia:
Batting : For last two years their batting style has remained the same. In this WC boundaries rate has risen!.
Bowling: Much improved bowling at end with Starc leading the attack. In each game they have improved their bowling performance.
Here is a statistical analysis
| Bat | India | Australia |
| Bat Avg | 52.91 | 39.88 |
| R/o | 5.97 | 7.05 |
| Scoring rate | 50.77 | 54 |
| Boundary rate | 11.30 | 14.47 |
| Centuries | 5 | 3 |
| Top 4 batsmen(contribution) | 69.01% | 60.48% |
| Eco rate | ||
| Maiden overs | 2.05% | 2.17% |
| < 4 runs/over | 42.05% | 29.02% |
| >6 runs/over | 47.18% | 56.30 % |
| >10 runs/over | 15.38 % | 25.12% |
| Partnerships | ||
| Partnerships (>100) | 7 | 5 |
Batting Powerplay
| Mandatory Power play | India | Australia |
| Bat Avg | 46.14 | 40.44 |
| R/o | 4.61 | 6.07 |
| Scoring rate | 31.90 | 40.28 |
| Boundary rate | 11.90 | 12.78 |
| Maiden overs | 7.14 | 3.33 |
| < 4 runs/over | 54.29 | 41.67 |
| >6 runs/over | 28.57 | 46.67 |
| >10 runs/over | 8.57 | 18.33 |
| Second power play | India | Australia |
| Bat Avg | Didn’t lose any wkt | 157.00 |
| R/o | 7.21 | 7.85 |
| Scoring rate | 64.29 | 60.83 |
| Boundary rate | 16.67 | 16.67 |
| Maiden overs | 0 | 5.00 |
| < 4 runs/over | 27.59 | 35.00 |
| >6 runs/over | 65.52 | 60.00 |
| >10 runs/over | 27.59 | 35.00 |
Run rate between each phase.
| Bat | 0-10 | (11-20) | (21-30) | (31-35) | (35-40) | PP II | LAST 10 overs |
| India | 4.61 | 5.08 | 5.15 | 6.28 | 7.21(PP II) | PP used | 8.97 |
| Australia | 6.07 | 5.01 | 6.34 | 8.18 | 8.60 | 7.85 | 11.25 |
BOWLING
| Bowling | India | Australia |
| Wkts | 70 | 58 |
| Bowl avg | 20.34 | 20.34 |
| Strike Rate | 26.23 | 23.17 |
| r/o | 4.67 | 5.29 |
| Scoring rate | 39.65 | 40.77 |
| Boundary rate | 8.28 | 9.90 |
| Low Eco Rate x Low St.Rate | 122.38 | 122.62 |
| Four wicket haul | 3 | 3 |
| Five wicket haul | 0 | 2 |
| Eco rate | ||
| % maiden | 7.54 | 4.04 |
| Consecutive < 4 runs/over | 34.08 | 36.32 |
| < 4 runs/over | 57.67 | 44.84 |
| >6 runs/over | 32.11 | 38.12 |
| >10 runs/over | 10.48 | 15.70 |
| Mode of dismissals | ||
| L B W | 4.29% | 1.72% |
| Bowled | 11.43% | 15.52% |
| Run out | 7.14% | 3.45% |
| Wicket keeper | 20.00% | 18.96% |
Bowling Powerplay
| Mandatory Power play | India | Australia |
| Wkts | 12 | 14 |
| Bowl Avg | 22.83 | 22.86 |
| R/o | 3.91 | 5.33 |
| Scoring rate | 27.38 | 36.11 |
| Boundary rate | 7.38 | 12.50 |
| Maiden overs | 14.29 | 6.67 |
| < 4 runs/over | 61.43 | 46.67 |
| >6 runs/over | 27.14 | 41.67 |
| >10 runs/over | 5.71 | 15.00 |
| Second power play | India | Australia |
| Wkts | 8 | 5 |
| Bowl Avg | 27.88 | 25.20 |
| R/o | 7.43 | 7.00 |
| Scoring rate | 52.2 | 46.30 |
| Boundary rate | 17.22 | 16.67 |
| Maiden overs | 0.00 | 5.56 |
| < 4 runs/over | 26.67 | 44.44 |
| >6 runs/over | 60.00 | 50.00 |
| >10 runs/over | 33.33 | 44.44 |
Run rate between each phase.
| Bowl | 0-10 | (11-20) | (21-30) | (31-35) | (35-40) | PP II | LAST 10 overs |
| India | 3.91 | 3.88 | 4.17 | 4.58 | 4.33 | 7.43 | 5.58 |
| Australia | 5.33 | 4.71 | 5 | 4.75 | PP used | 7.00 | 4.15 |
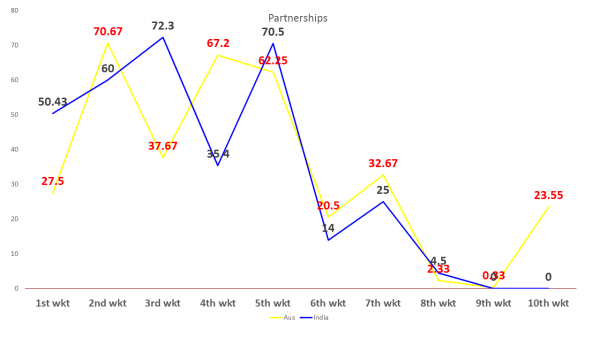
Partnerships
| Batting | Aus | India |
| 1st wkt | 27.5 | 50.43 |
| 2nd wkt | 70.67 | 60 |
| 3rd wkt | 37.67 | 72.3 |
| 4th wkt | 67.2 | 35.4 |
| 5th wkt | 62.25 | 70.5 |
| 6th wkt | 20.5 | 14 |
| 7th wkt | 32.67 | 25 |
| 8th wkt | 2.33 | 4.5 |
| 9th wkt | 0.33 | dnb |
| 10th wkt | 23.55 | dnb |
links to all the stats indicators http://allthatcricket.com/?p=1489


