Here is a look at venues that will host World Cup matches in Australia. Since new fielding rule was prescribed (Nov 2012)there were 25 ODI matches played in Australia. Overall batting average is very healthy at 30.49 @5.21/over.
The average score for teams batting first is 235, and in that seven scores of 300 plus scores(overall 9).
Here is a brief look at all venues.The stats is sum of both teams. The scoring rate is much higher in Canberra and Hobart, and MCG and Adelaide are using drop-in pitches.
| Venues | Mt | Avg | R/o | Scoring rate/100 balls | Boundary rate |
| WACA | 6 | 25.16 | 5.13 | 42.44 | 9.23 |
| SCG | 6 | 35.21 | 5.17 | 45.52 | 8.81 |
| Canberra | 2 | 38.84 | 6.28 | 54.08 | 11.63 |
| MCG* | 5 | 35.30 | 5.46 | 49.95 | 8.45 |
| Hobart | 2 | 35.63 | 5.40 | 51.09 | 8.57 |
| Gabba | 2 | 24.07 | 4.99 | 42.53 | 7.43 |
| Adelaide* | 2 | 24.87 | 4.15 | 40.59 | 5.89 |
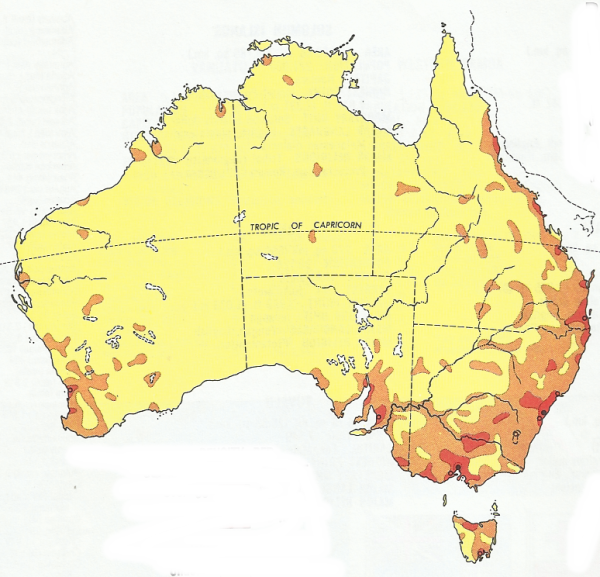
Scoring rate is highlighted in the map below.
links to all the stats indicators http://allthatcricket.com/?p=1489


