
21 Jun 2011 Last updated at 7:33 amSri Lanka in England(2011). Teams needed to maintain their excellent start.

In forthcoming series, the Sri Lankans need to take advantage of the start they get(both in batting & bowling).

In England, Sri Lanka had played 6 games & in those games (12 innings) their average opening stand has been brilliant @ 76.07 (3 double century stand, & 3 fifties). This allowed them to post huge score. Same was the case in last Test series against West Indies at home, where their batsmen performed brilliantly.

Meanwhile their bowlers did a honest job of picking the first wicket very early, considering that their bowling attack is fairly inexperience, with both Muralitharan & Malinga retiring from Test cricket.

However if they have to become a force in Test cricket, & win more games overseas, then they require genuine set of fast swing bowlers, & right now they have Suranga Lakmal who is excellent with the new ball, although his experience is limited to 5 Tests matches, & has picked 10 wickets, but, good part for the Lankans is, out those dismissals, six batsmen were(60 %) dismissed for less than 10 runs, which says a lot on how he is able to use the new ball against quality batsmen.

If Chanaka  Welegedara can get his radar right which is not easy for a left-armer, then both he and Lakmal can trouble the best  batting side in world cricket. Like Lakmal, Welegedara has played few Test matches, but good part for him is, that  47.36% of victims as bowled & LBW!!.

Sri Lanka bowlers fail to capitalise!.

Despite getting an excellent start by opening bowlers, host teams manage to post big scores against the islanders. Here is a GFX of how Lankans bowlers fail to capitalise the start they attained


Sri Lanka v West Indies (2010)

Before the tour of England, Sri Lanka hosted West Indies to play a 3-Test series last Dec. Although there was no result in any of those games, but the Lankan openers(batting pair, & opening pair of bowlers) did a commendable job

Tests Sri Lanka Opening Pair Wes Indies Opening Pair
1st Test 378 all out 6 580-9 110
2nd Inn 241-4 102 Did not bat Did not bat
2nd Test 387-9dec 10 243 all out 7
2nd Inn 57-1 55 12-2 9
3rd Test Did not bat Did not bat 303-8 0
2nd Inn Did not bat Did not bat Did not bat Did not bat

The Rose Bowl

Did openers lose opportunity at Southampton!.

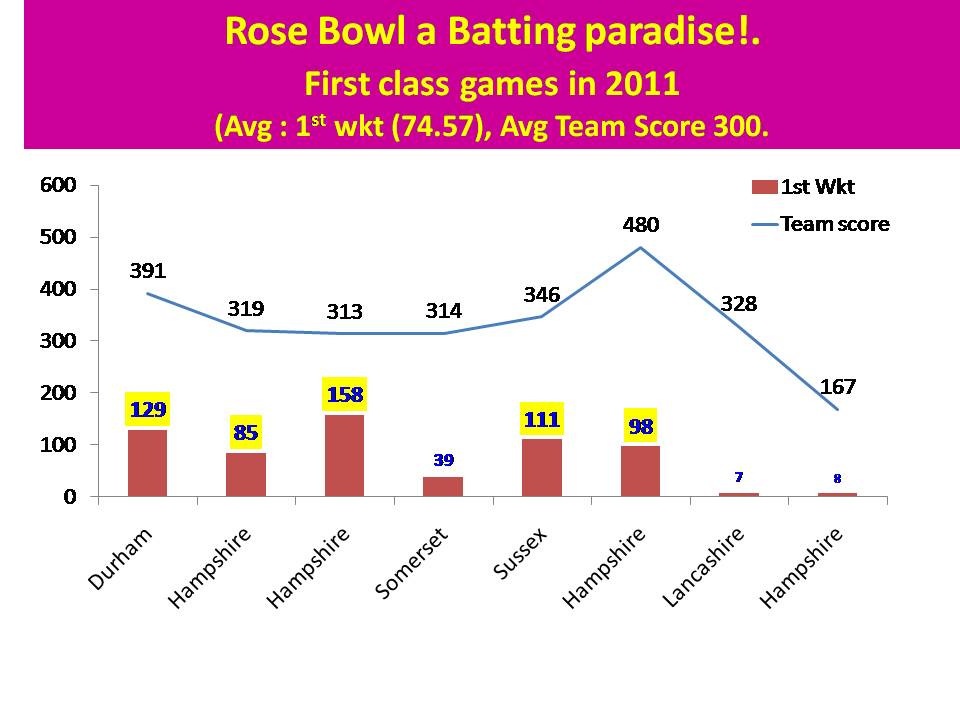
Weather did play a big part in depriving both teams of a result. This venue has been helpful for seam and swing bowling, especially in the first session of a day. However after that it becomes easy for batsmen to score plenty of runs, & so far this is only the second time weather intervened at Rose Bowl.

Here is a GFX of 1st class games played this year at Rose Bowl.

A snap shot of teams scores & opening stand,  both for Hampshire(home side) & visiting sides.
Australian Venue

[nggallery id=22].  

More Galleries | Leave a comment

England Venues

[nggallery id=21].

More Galleries | Leave a comment

19 Jun 2011 Last updated at 8:17 amIndicator & Formula (all formats)


A Guide to Indicators & Formulas

Abbreviation & Meaning used in this index

Batting Indicator (Primary)

Abbreviation Indicator
Bat Avg Batting Average
SS Scoring Shots
SS/Balls Scoring rate per 100 balls
SS(singles)% Scoring rate in singles
SS(boundaries)% Scoring rate in Boundaries
B/W Balls per Wicket or Bowling St.Rate
Value %  Batsman scored Runs/Team Avg.
Role % Batsman’s scored Runs/(Team’s End score – Begin score)
Begin Score Team’s score at beginning of a batsman’s Innings
End Score Team’s score at end of a batsman’s Innings


Batting Indicator (Secondary)

Abbreviation Indicator
St. Rate Strike. Rate
4s % % of Boundaries
1s %  % of singles
0s % % dot balls
R/Hr Runs per Hour
“0” Marker(No.of balls to get off the mark)


Bowling Indicator (Primary)

Abbreviation Indicator
Bowl Avg Bowling Average
R/O Runs per Over
B/W Balls per Wicket or Bowling St.Rate
SS Scoring Shots
SS/Balls Scoring  rate per 100 balls
SS(singles)% Scoring rate in singles
SS(boundaries)% Scoring rate in Boundaries
C 4 Consecutive less than 4 runs
L 4 Less than 4 runs per over
L 3 Less than 3 runs per over
C 3 Consecutive less than 3 runs
LER Low Economy Rate
LSR Low Strike Rate
X  Factor LER x LSR

 Note : L3, L 4 – are called as Less than, and CM, C3, C 4 are called as Consecutive 

Bowling Indicator (Secondary)

Abbreviation Indicator
4s % % of Boundaries
1s %  % of singles
0s % % dot balls
NB & W % % of Error Balls(NB & W)
B & LB % % of byes & leg byes
1ball(runs)% % runs scored of 1st ball of an over…look at number of ball bowled and find the average score of each ball. From Batting perspective how many times a teams are able to score from these balls – from Bowling perspective for the same balls how times bowlers and their team have prevented opposition Batsmen from scoring.
2ball(runs)% % runs scored of 2nd ball of an over
5ball(runs)% % runs scored of second last  ball of an over
6ball(runs)% % runs scored of last ball of an over
1ball(wkts)% % wkts on 1st ball of an over
2ball(wkts)%   % wkts on 1st ball of an over
5ball(wkts)% % wkts on 1st ball of an over
6ball(wkts)% % wkts on 1st ball of an over
6+/over % 6 => runs conceded in an over
10+/over % 10 = > runs conceded in an over


The Gap Factor

All teams want to win a cricket match, or at least not lose one.

Batting side(offense) will always want to score more runs in less balls, at same time lose less wickets. On the other hand the bowling side(defense) wants to pick wickets in less balls, and concede less runs.

This reflects their strength and weakness. To find out how they go about it in terms of data/stats/numbers – we deviced something called “The gap factor”.

Its similar to NRR but with only one calculation – minus the batting performance with bowling performance. If the numbers is in plus figure than that team is doing well in that particular indicator, but if the numbers are in minus figure than that team is performing poorly in  that department.

(625)…Impact Points Leverage(IPL)

19 Jun 2011 Last updated at 8:15 amBorder – Gavaskar series (2001)

Cricket (2005-2010)…in nutshell!.

embedded by Embedded Video

More Galleries | Leave a comment

Sub Continent Kings (India & Sri Lanka)

embedded by Embedded Video

More Galleries | Leave a comment

Tests in England (Venuewise & Monthwise )1880-2010–Part II

embedded by Embedded Video

More Galleries | Leave a comment

Tests in England(Venuewise/Monthwise )1880-2010 – Part I

embedded by Embedded Video

More Galleries | Leave a comment

Minnows slow rise to Int.Cricket.

embedded by Embedded Video   A rotation policy in cricket (especially if bowlers are rested)is always questioned by all(especially in cricket) hence I feel if ICC can add minnows in FTP on regular basis, in where each major team can … Continue reading →

More Galleries | Leave a comment

13 Jun 2011 Last updated at 10:09 amWC2011(2nd semi-finals,INDO PAK)Neighbours choke at the end.

embedded by Embedded Video

WC2011(1st semi-finals)Chaos Theory should work between SL-NZ contest.inals

embedded by Embedded Video

More Galleries | Leave a comment

World Cup Champions & their key players.

This gallery contains 10 photos.

As the 12th edition of ICC World Cup begins tomorrow(30th May 2019). Here is a look at average age of 15 member squad of teams participating in this tournament. Interestingly this World Cup has maximum players who are 30 plus. … Continue reading →

More Galleries | Leave a comment

One Day Cricket (40 Years) till 2010.

This gallery contains 1 photo.

More Galleries | Leave a comment

13 Jun 2011 Last updated at 3:16 amMaking of Champions(Perfect Preparation)- IV

embedded by Embedded Video