(332)….Turn over to Ashes 2001, when it all started.

This gallery contains 5 photos.

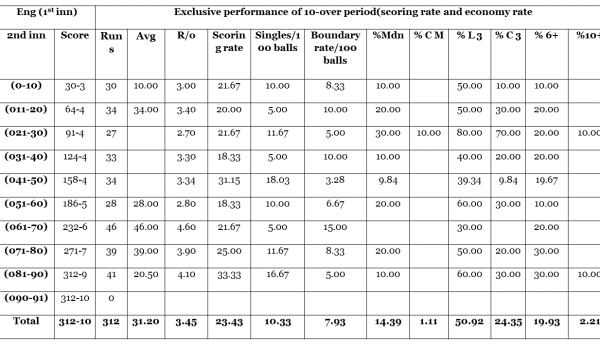
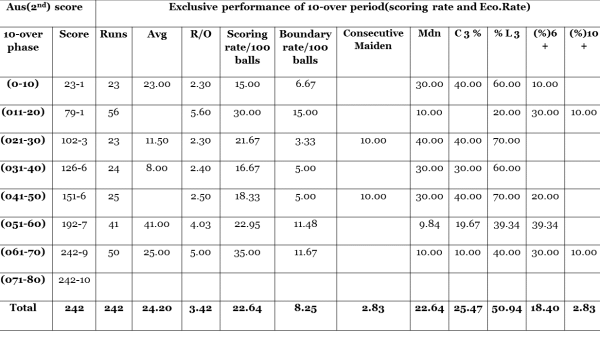
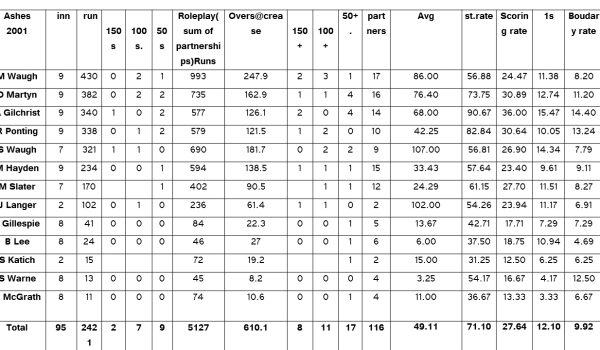
In the turn of this century run rate of 3 per over was considered fast-scoring for Test cricket. Australia started this trend of scoring fast, and interestingly their rate was 4.27 per over during their tour of UK in 2001. … Continue reading

More Galleries | Leave a comment

(330)…2nd Ashes Test(Phases)

This gallery contains 8 photos.

2nd Ashes Test, Lord’s. A stats analysis of 10-over phases  Australia who batted first lost only 1 wicket on day 1, a feat rarely seen in Test matches today.   In the first Test, among scoring shots the singles were … Continue reading

More Galleries | Leave a comment

(328)..The Ashes-1st Test: Phases

This gallery contains 6 photos.

    1st Ashes Test, Sophia Gardens, Cardiff. A stats analysis of 10-over phases  Interestingly after the 50th over in first innings (bat/bowl) the momentum changed in favor of host England. Australia could never reign in. Here is a link to … Continue reading

More Galleries | Leave a comment

(323)…Indian Proportion Level(IPL8) Win factor

This gallery contains 3 photos.

Before the finals the average first bat score is 166 – but the win factor is slightly more at 177. And how many times teams have successfully chased down that target? –Just 5 out of 21 times(>177 target). Suggesting irrespective … Continue reading

More Galleries | Leave a comment

(321-a)Indian Proportion Level: Phases for play-off teams.

  Here is how teams that have qualified in play-offs have performed in each phase of IPL – here is a link to bowler’s performance in each phase. http://allthatcricket.com/?p=8373                                      Batting performance.      Bat Overs Runs   Wkts     … Continue reading

More Galleries | Leave a comment

(321-b)…Indian Proportion Level(IPL)play-off bowlers in phases.

A Nehra and M Starc conceded less than 7 runs in last 5 overs (min 10 overs in the phase)of this tournament.   Here is a list of bowlers who bowled minimum of 20 overs in this tournament. Here is a … Continue reading

More Galleries | Leave a comment

(320)…Bowling changes(most effective factor)Indian Proportion level(IPL8)

This gallery contains 8 photos.

Bowling changes – in a 20-over innings- after the mandatory first and second over, there can be 18 maximum bowling changes. Minimum 3 bowlers required to bowl in that inning. e.g the first over is bowled by A-bowler followed by … Continue reading

More Galleries | Leave a comment

(319)…Prophecy of statistics: Net Run Rate

What is a Net Run Rate(NRR) and how is it calculated : Run rate scored divided by run rate conceded. However it does not include runs and wickets of abandoned games. These score are not summed up while calculating net … Continue reading

More Galleries | Leave a comment

(318)…Two most touted teams (KKR v/s MI) in 51st game(Indian Proportion level(IPL8).

This gallery contains 5 photos.

End of 50th game Quite a huddle I would say.. With 2 or less games left, technically six teams have a chance to qualify for play-off. Here is how teams are standing. IPL 2015 Mt Win Points NRR(ICC) NRR(Allthatcricket) CSK … Continue reading

More Galleries | Leave a comment

(317)…..Indian Proportion level(IPL8): Contest more competitive

                            2014 At this time(end of 47th game)last year in IPL7. The table was dominated by two teams  KPXI & CSK… IPL 2014 Mt Win PTS KPXI 11 9 18 CSK 12 8 16 KKR 12 7 14 RR 12 … Continue reading

More Galleries | Leave a comment

(315)…Time to Redeem runs at Kolkata(Indian Proportion level)

This gallery contains 3 photos.

Last year matches played in Kolkata and Mohali had the least batting average – As the tournament progressed runs became hard to come by -especially after the 10th over till the 15th…..however it has not been the same this year’s … Continue reading

More Galleries | Leave a comment

(314)…Runs trickling not gushing (Indian Proportion level-end 27)

This gallery contains 7 photos.

At end of 27th game – Average score batting first is 166 – a drop by 4 runs since end of 20th game.  An overall drop of 2 points  in batting average in same period, now the batting average is … Continue reading

More Galleries | Leave a comment

(313)…World Cups: Australia- Five time World Champions

This gallery contains 8 photos.

                                                                                … Continue reading

More Galleries | Leave a comment

(312)Game 21: A throw down between Best/worst bowling side(Indian Proportion Level)

This gallery contains 1 photo.

At end of 20 games – Success rate is 60.00% for teams that batted second. Nevertheless the average score for first batting has climbed to 171 from 167 in last 5 games – which has made slightly difficult for teams … Continue reading

More Galleries | Leave a comment

(311)..287 fours/140 sixes(Indian Proportion level)10 games

This gallery contains 5 photos.

At end of 10 games (IPL8) 2015 Up till now, batsmen have dominated the tournament – a score of 150 is easily chased and anything above 170 seems to be much easier. The last 3 games saw teams chase down … Continue reading

More Galleries | Leave a comment