A review of recently concluded Trans Tasmanian series. This series favored batsmen (albeit Adelaide day night Test) hence not surprisingly the new ball (from 0-20 overs and another 20 overs of second new ball which is taken any time after the 80th over)produced only 14 wickets(out of 93) for both teams, i.e 15.05% wickets fell to new cherry.
Both teams lost only 7 wickets each with New Zealand(13.46%) using it better than Australia (17.07%)
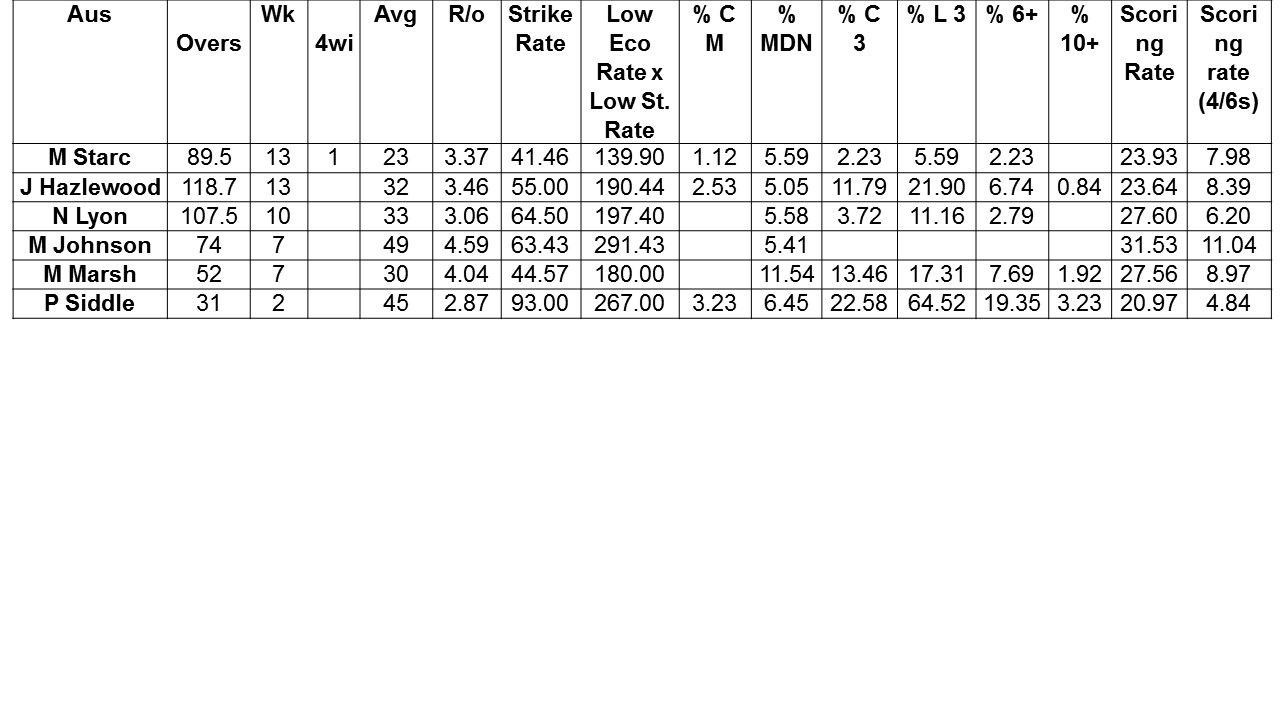
Performance Indicators – Australia(bat/bowl)
.jpg)
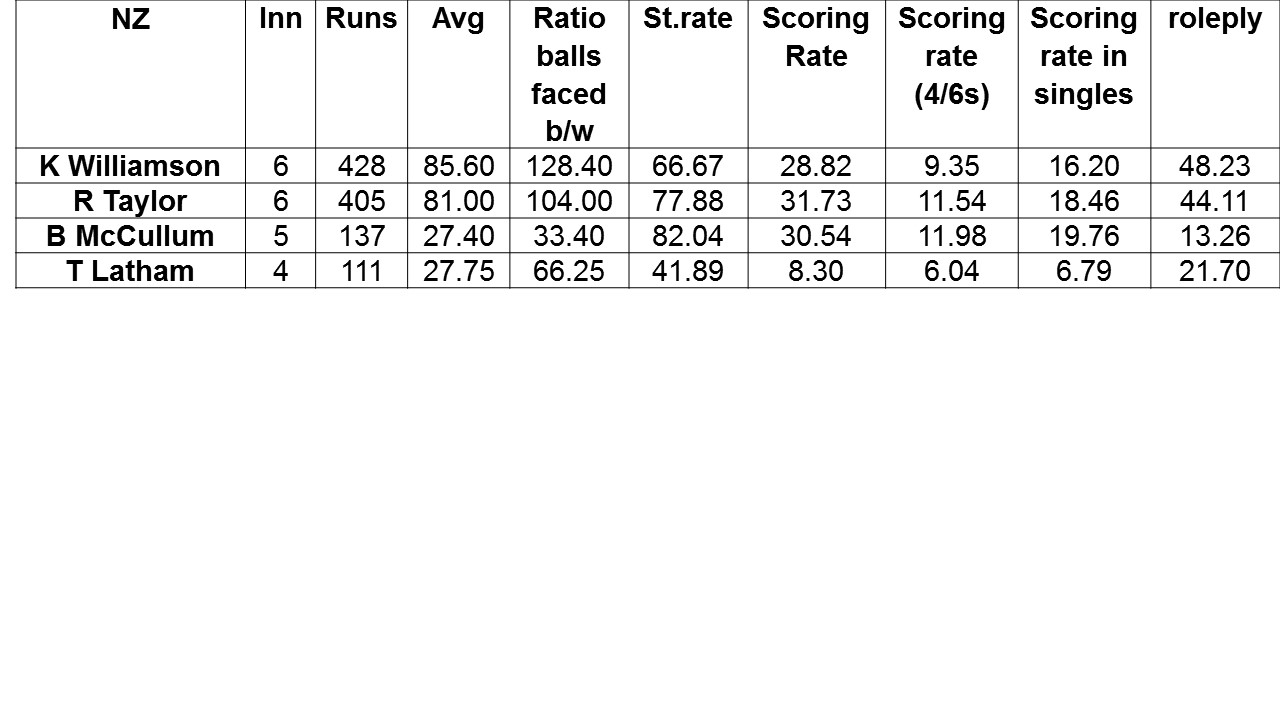
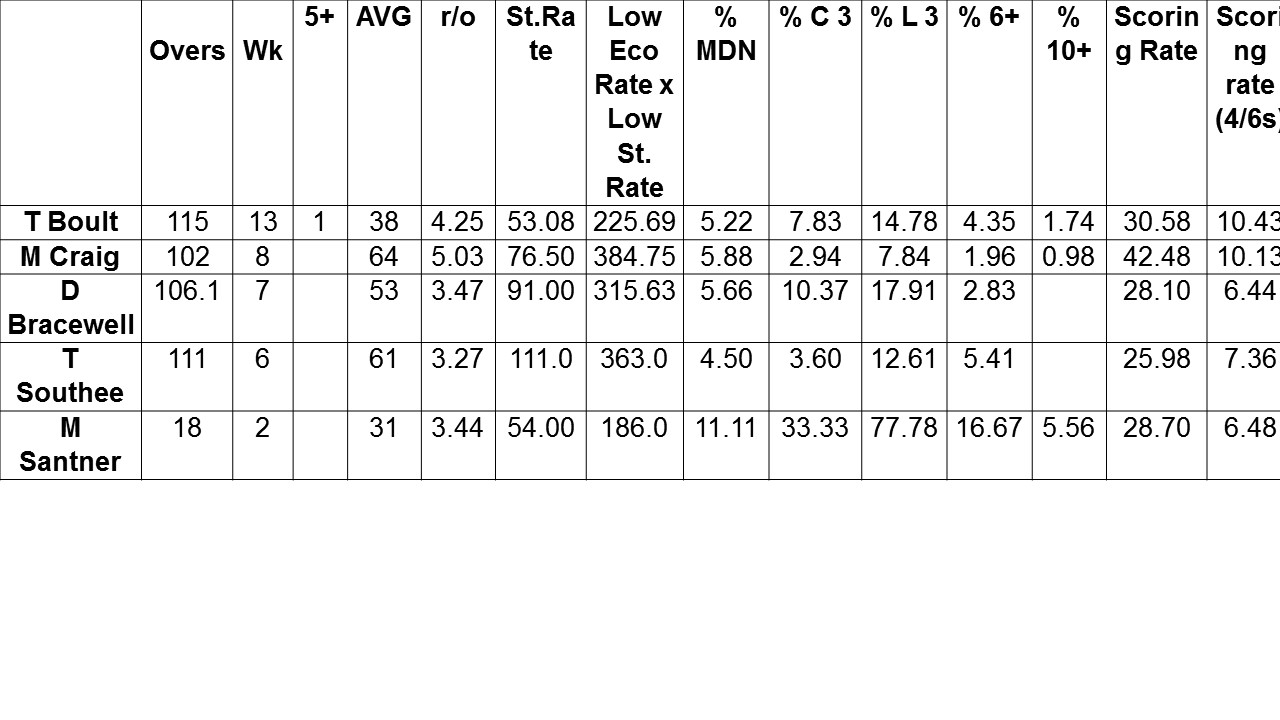
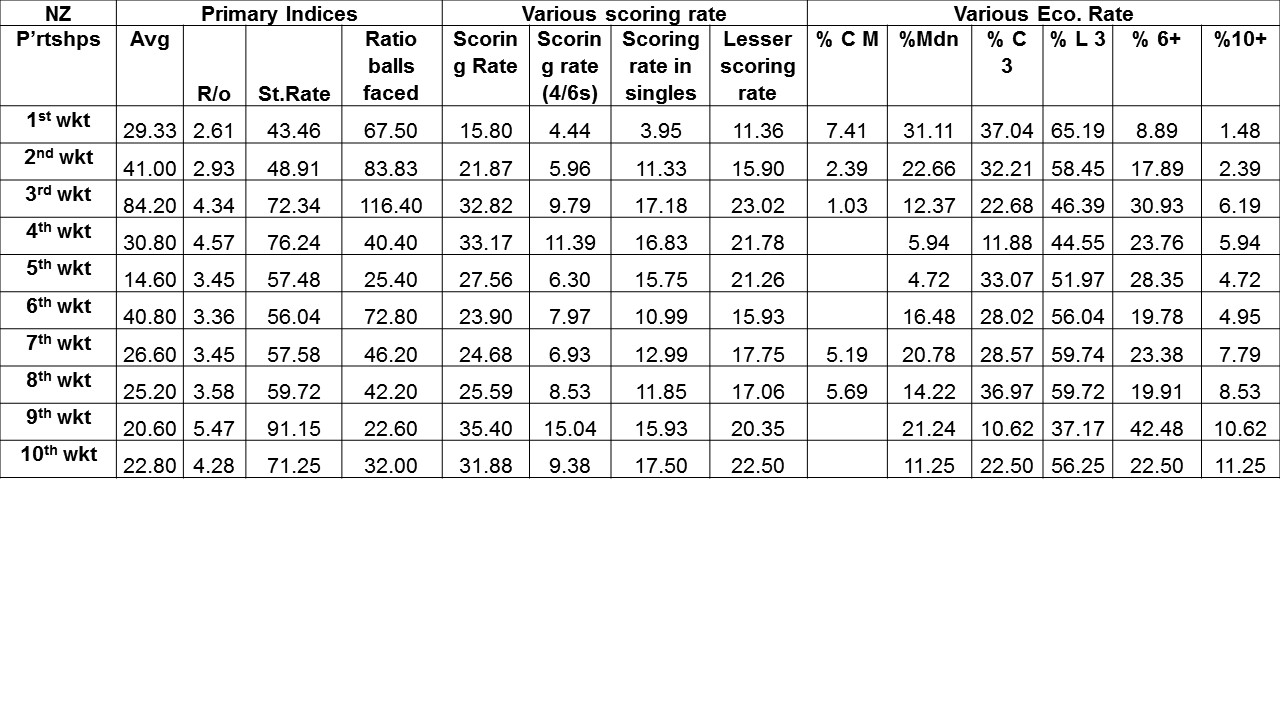
Performance Indicators – New Zealand (Bat/Bowl)
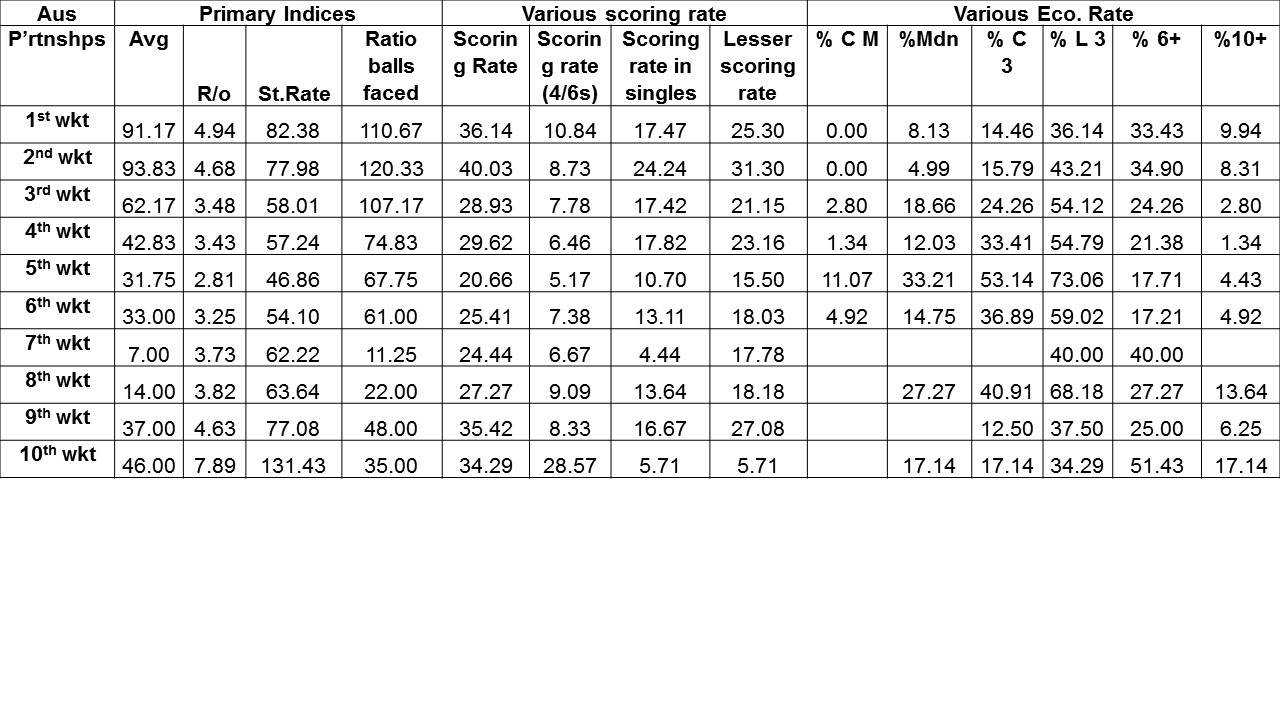
Partnerships indicators
Below graphic clearly indicates a rise and fall for both teams in batting partnerships . Interestingly for Australia, they started the series with grand style, as the first 3 Inns produced opening century stand(Avg 91.17) overall 5 successive(4 consecutive)century stand from Oval Test(last Ashes Test).
![]()
Australia batting partnerships with all indicators
New Zealand batting partnerships with all indicators
Batting phases for Australia
.jpg)
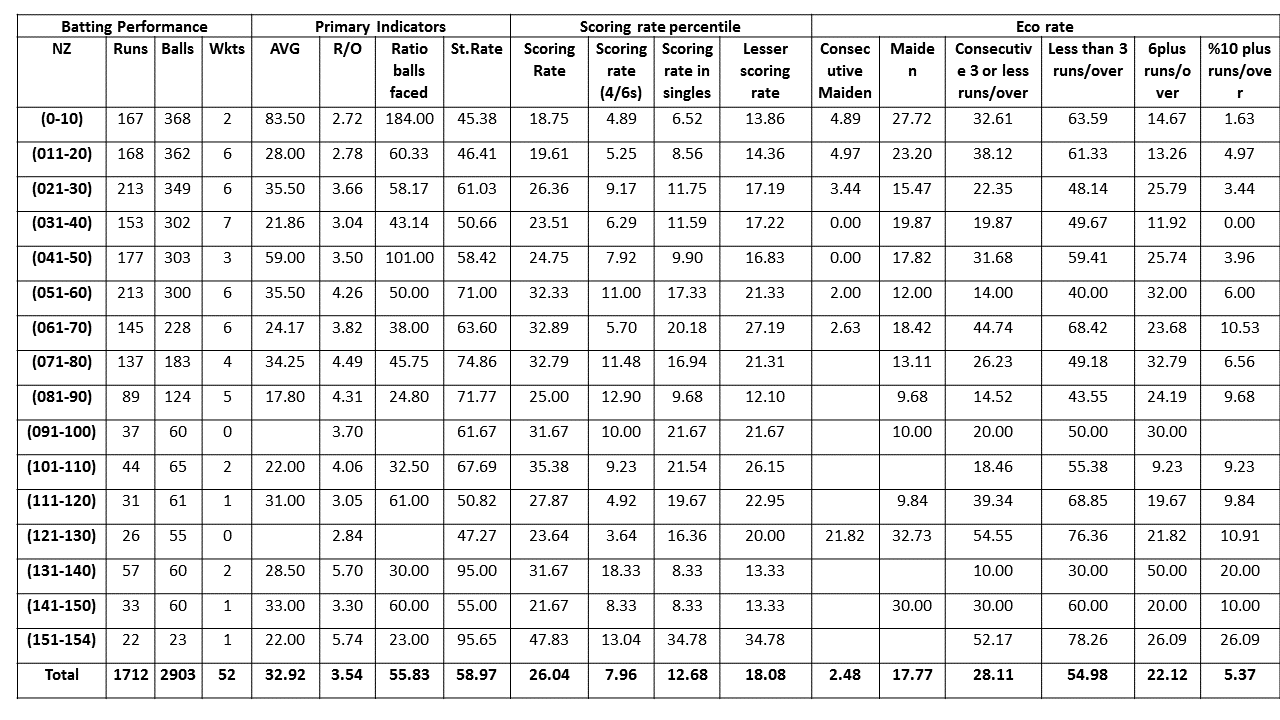
Batting phases for New Zealand
Here is a link to all the stats indicators http://allthatcricket.com/?p=1489
