Here is a brief analysis of Sachin Tendulkar’s Test performance with age factor used as major indicator.
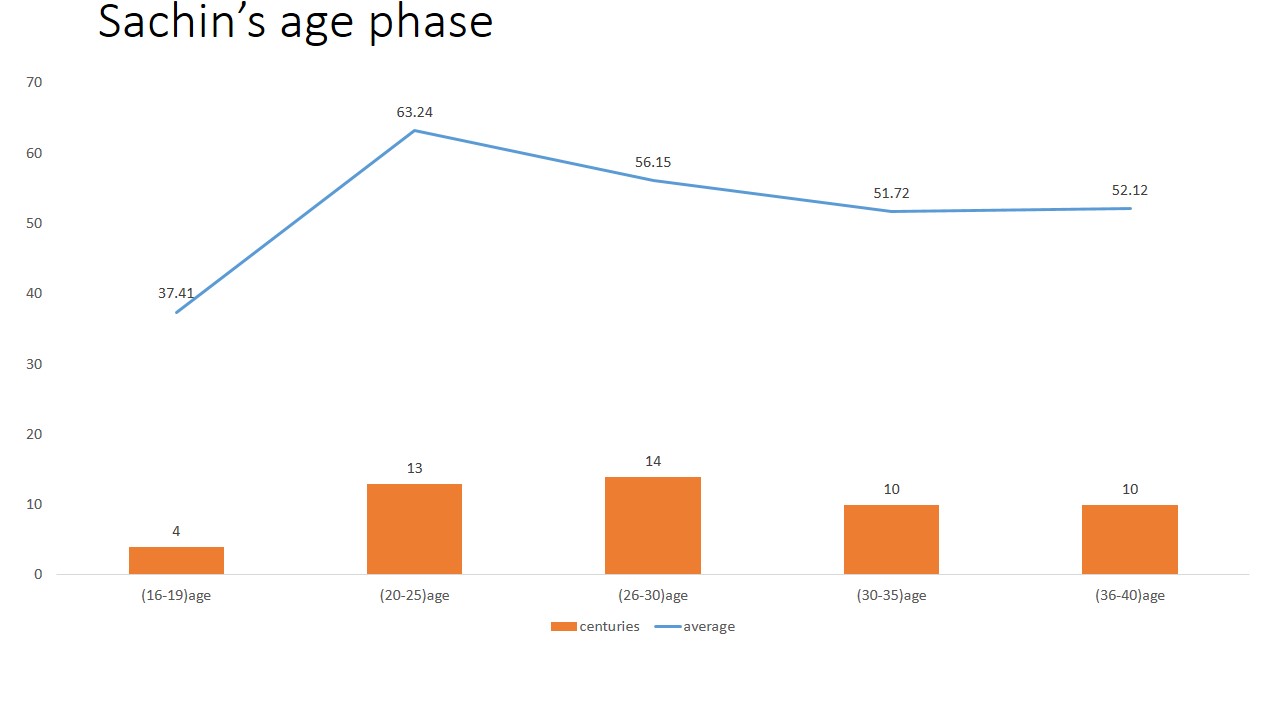
a) Age phase : all stats in this table is from beginning and end of each age mentioned in first column.
| Age phase | Tests | Runs | 100s | Avg |
| 16-19 | 20 | 1085 | 4 | 37.41 |
| 20-25 | 43 | 3668 | 13 | 63.24 |
| 26-30 | 47 | 4211 | 14 | 56.15 |
| 30-35 | 46 | 3465 | 10 | 51.72 |
| 36-40 | 44 | 3492 | 10 | 52.12 |
| 200 | 15921 | 51 | 53.79 |
In GFX
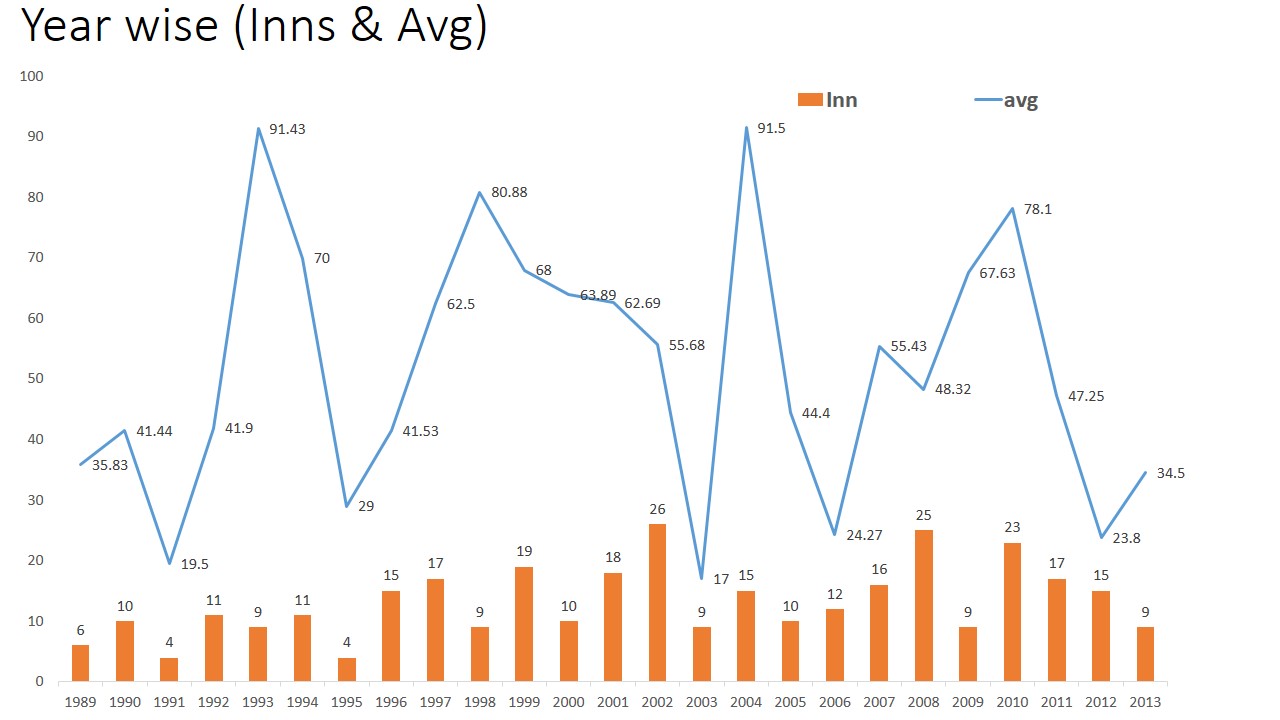
b) Year wise performance with age and # years of Test experience as primary indices
| Year wise | Age | Inn | Test year experience | Runs | Avg |
| 1989 | 16 | 6 | 0 | 215 | 35.83 |
| 1990 | 17 | 10 | 1 | 373 | 41.44 |
| 1991 | 18 | 4 | 2 | 78 | 19.50 |
| 1992 | 19 | 11 | 3 | 419 | 41.90 |
| 1993 | 20 | 9 | 4 | 640 | 91.43 |
| 1994 | 21 | 11 | 5 | 700 | 70.00 |
| 1995 | 22 | 4 | 6 | 58 | 29.00 |
| 1996 | 23 | 15 | 7 | 623 | 41.53 |
| 1997 | 24 | 17 | 8 | 1000 | 62.50 |
| 1998 | 25 | 9 | 9 | 647 | 80.88 |
| 1999 | 26 | 19 | 10 | 1088 | 68.00 |
| 2000 | 27 | 10 | 11 | 575 | 63.89 |
| 2001 | 28 | 18 | 12 | 1003 | 62.69 |
| 2002 | 29 | 26 | 13 | 1392 | 55.68 |
| 2003 | 30 | 9 | 14 | 153 | 17.00 |
| 2004 | 31 | 15 | 15 | 915 | 91.50 |
| 2005 | 32 | 10 | 16 | 444 | 44.40 |
| 2006 | 33 | 12 | 17 | 267 | 24.27 |
| 2007 | 34 | 16 | 18 | 776 | 55.43 |
| 2008 | 35 | 25 | 19 | 1063 | 48.32 |
| 2009 | 36 | 9 | 20 | 541 | 67.63 |
| 2010 | 37 | 23 | 21 | 1562 | 78.10 |
| 2011 | 38 | 17 | 22 | 756 | 47.25 |
| 2012 | 39 | 15 | 23 | 357 | 23.80 |
| 2013 | 40 | 9 | 24 | 276 | 34.50 |
| Total | 40 | 329 | 24 | 15921 | 53.79 |
In GFX
Here is a link to meaning of all ndicators/formula – http://allthatcricket.com/?p=1489
