At end of 3rd Ashes Test @WACA, a comparison of current Ashes series with previous one played in UK (June- Sept 2013).
Below is GFX based analysis of Ashes comparison(Ashes 2013 v/s Ashes 2013-14) at end of 3rd Test.
The arrows suggest how teams have progressed/regressed in a particular indicator.
Some indices shown great improvement. For e.g In Australia’s batting (current series) has less C M, % Maidens, C 3, & L 3 suggesting they are constantly looking for runs, & not allowing English bowlers to dictate and bowl high% of maiden, C 3, L 3, & C M- at same time increase in % of > 6runs/over.
And some indices fall drastically, viz England’s batting has reduced considerably.
On touch screen, you will find No. of players used by teams in both series at end of 3rd Test. Australia in current series have retained the same XI in all 3 Tests, which was not the case in UK, where they had used 15 players. While England, have used 14 players in current series, compare to 12 they had used back at home.
In UK , at end of 3rd Test, England were 2-0 in the series .Now in Australia, they are 0-3 after 3rd Test.
Table 1 : Primary Indicators
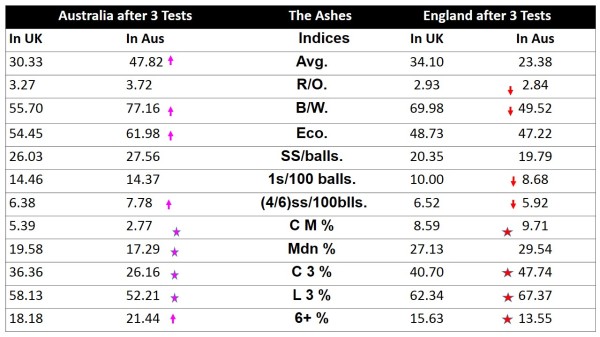
reflects how Australia arrested their batting problem in the current series. They jumped 18runs avg/wkt, with help from B/W ( steep climb in % of balls faced/wkt- 56 to 77 balls) and slight increase in run-rate. In here, run-rate helped by increase in % of boundaries (% singles & scoring rate remained same) resulting in more >6 runs/overs, and reduction in % Mdns, % C M, %C 3, % L 3.
While England almost maintained their scoring rate, & runs/over, but regular fall of wickets had adverse effect on their average and B/W.
Their inability to score regular boundaries reflects in decrease in (% >6 runs/over) and marginal rise in % % Mdns, % C M, %C 3, % L 3.
,
Table 2 : The Batting Order
A major problem for Aussies in UK . The top order had 3 openers, 2 at No. III, & 3 at No.IV. They tried in vain to arrest this issue in this series. There was only 1 century(3rd Test end) by an Australian, compare to 5 scored by England. Nevertheless England’s problem went unnoticed as they were leading the series 2-0, eventually winning 3-0 comfortably. Touch screen reflects centuries scored by batting positions.

Table 3 : Partnerships

Similar to batting order, there was lack of substantial partnerships for top order. Here too, there were only 1 century partnership for Aussies (3rd Test end) against 6 by England. Touch screen reflects >100 run partnerships for particular wicket.
Bowlers
England: Both Anderson & Swann were very effective in first 3 Tests, picking 15 & 19 wkts respectively. Then in last 2 games Broad picked 16 wkts to take his tally to 22 in the series!.
Interestingly at end of 3rd Test, Swann had bowled maximum overs(173) from either side. His contribution for England was 34.53% (Australia batted for 501 overs in 3 Tests).
| England | Tests | Overs | Runs | Wkts | Avg | B/W | L E R x L S R | L 3(%) | C 3(%) |
| G Swann | 3 | 173 | 520 | 19 | 27.37 | 54.32 | 151.81 | 61.41 | 34.76 |
| J Anderson | 3 | 128.5 | 391 | 15 | 26.07 | 51.53 | 153.91 | 54.47 | 21.79 |
| T Bresnan | 2 | 59 | 197 | 7 | 28.14 | 50.57 | 185.81 | 59.32 | 25.42 |
| S Broad | 2 | 101.5 | 312 | 6 | 52.00 | 101.50 | 157.48 | 59.11 | 26.60 |
| S Finn | 1 | 25 | 117 | 2 | 58.50 | 75.00 | 365.04 | 36.00 | 16.00 |
Australia: As far taking wickets was concerned, only R Harris was effective. His series tally was 24 wkts in 4 Tests & at end of 3rd Test, he had 11 in 2 games.
| Tests | Overs | Runs | Wkts | Avg | B/W | L E R x L S R | L 3(%) | C 3(%) | |
| P Siddle | 3 | 123.1 | 347 | 16 | 21.69 | 46.44 | 131.65 | 62.55 | 33.31 |
| R Harris | 2 | 82.1 | 198 | 11 | 18.00 | 44.82 | 96.86 | 71.86 | 40.19 |
| M Starc | 2 | 80 | 217 | 8 | 27.13 | 60.00 | 122.63 | 56.25 | 26.25 |
| J Pattinson | 2 | 91.1 | 307 | 7 | 43.86 | 78.14 | 189.13 | 52.69 | 24.15 |
| A Agar | 2 | 84 | 248 | 2 | 124.00 | 252.00 | 145.28 | 58.33 | 28.57 |
| N Lyon | 1 | 38 | 103 | 1 | 103.00 | 228.00 | 122.45 | 68.42 | 39.47 |
| S Watson | 3 | 61 | 114 | 1 | 114.00 | 366.00 | 58.21 | 70.49 | 32.79 |
