Australia is a nation that has factories manufacturing successive leaders.
We all say we adapt and change according to time, but there are few who have the ability to enforce and manufacture change. Steve Waugh is one of rarest leaders who manufactured change. In sports he is one of few captains who took his team/players beyond everyone’s expectation.
Here is a list of all Australian Test captains from 1998-99 till Ashes 2015
|
Leaders |
Period |
|
S Waugh |
1999-2004 |
|
R Ponting |
2004-2011 |
|
M Clarke |
2011-2015 |
|
A Gilchrist |
2000-2004 |
|
S Smith |
2015 |
|
S Watson |
2013 |
Table 2- Batting/Bowling – primary indicators(under various captains)
|
Australia Test cricket |
Batting Indicators |
Bowling Indicators |
||||
|
(1999-2015) |
Avg |
Balls/wkt |
r/o |
Avg |
Balls/wkt (Strike rate) |
r/o |
|
Steve Waugh |
43.17 |
70.58 |
3.67 |
27.45 |
54.11 |
3.05 |
|
Ricky Ponting |
40.49 |
68.99 |
3.53 |
30.45 |
56.57 |
3.23 |
|
M Clarke |
35.66 |
61.95 |
3.46 |
30.09 |
57.29 |
3.16 |
|
Adam Gilchrist |
34.59 |
61.16 |
3.40 |
25.77 |
52.82 |
2.94 |
|
S Smith |
48.04 |
70.64 |
4.08 |
37.70 |
70.28 |
3.22 |
|
Watson |
21.30 |
47.60 |
2.69 |
30.71 |
43.57 |
4.24 |
|
Total |
39.69 |
67.14 |
3.55 |
29.43 |
56.04 |
3.16 |
Table 3- Margin of success rate of various Australian Test captains from 1999-2015
|
|
Success |
Big margin of win(>100 runs, > 7 wickets, Inns win, >1 day remaining) |
Big lead in win games |
|||||
|
Leaders |
Tests |
success |
>100 runs |
>7 wkts |
Inns wins |
A day or more to spare |
>100 |
>200 |
|
S Waugh |
57 |
41(71.93%) |
8(14.04%) |
11(19.30%) |
14(24.56%) |
21(36.84%) |
34(59.65%) |
22(38.60%) |
|
R Ponting |
77 |
48(62.34) |
22(28.57%) |
10(12.99%) |
7(9.09%) |
18(23.38%) |
28(36.36%) |
19(24.68%) |
|
M Clarke |
47 |
24(51.06) |
12(25.53%) |
3(6.38%) |
4(8.51%) |
14(29.79%) |
19(40.43%) |
8(17.02%) |
|
A Gilchrist |
6 |
4(66.67) |
3(50.00%) |
0.00% |
0.00% |
2(33.33%) |
3(50.00%) |
2(33.33%) |
|
S Smith |
3 |
1(33.33) |
0.00% |
0.00% |
0.00% |
1(33.33%) |
0.00% |
0.00% |
|
S Watson |
1 |
0.00 |
0.00% |
0.00% |
0.00% |
0.00% |
0.00% |
0.00% |
|
Total |
191 |
118 |
46(24.08%) |
25(13.09%) |
26(13.61%) |
58(30.37%) |
88(46.07%) |
52(27.23%) |
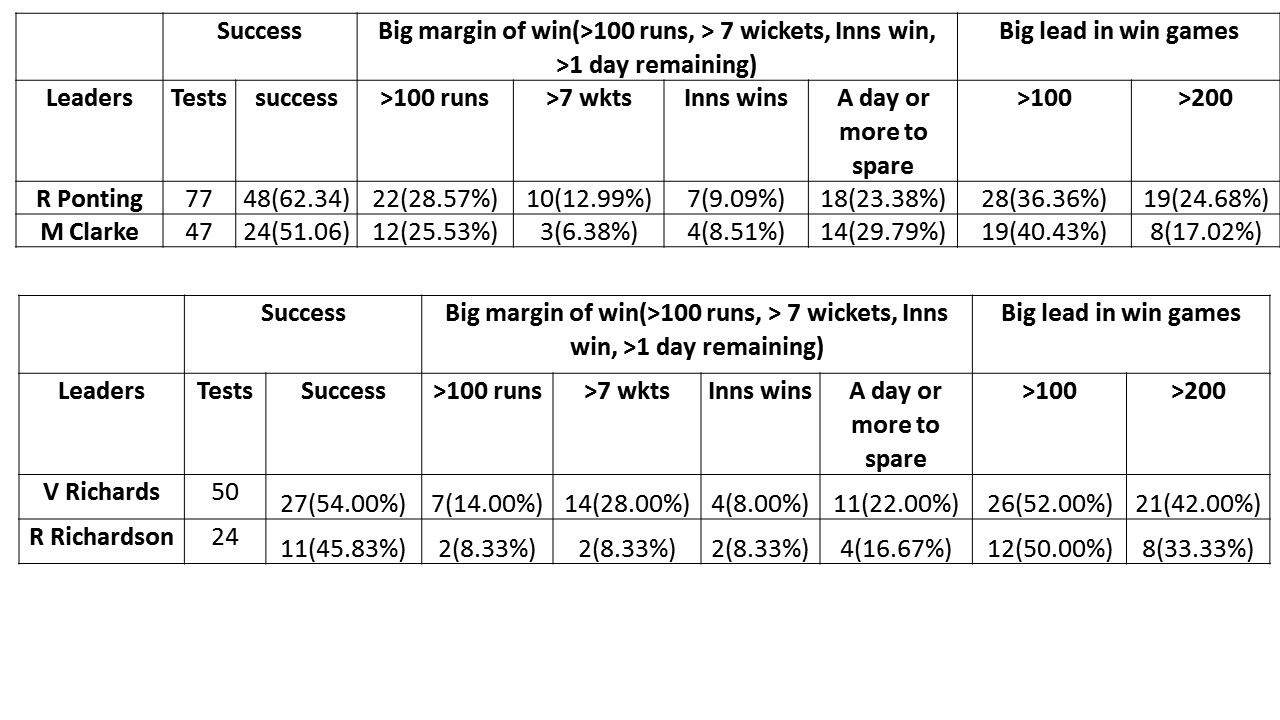
A country that has factories producing leaders – that factory is sport, a rich history of leaders. It has produced success in all sport and at all levels in every generation. I thought to compare the Great West Indies team led by Clive Lloyd with Great Australian team led by Steve Waugh.
Here is snap shot of margin of success for both leaders
.jpg) What is the interesting in the above table is under Lloyd’s leadership West Indies won more games with huge margins which was provided with huge lead (>200). On the other end, Waugh’s leadership saw Australia with maximum inning wins, and Test match getting over inside 4 or less days. Along with this Steve Waugh’s Team holds the record of 16 successive Test win, which no team has ever achieved in any sport.
What is the interesting in the above table is under Lloyd’s leadership West Indies won more games with huge margins which was provided with huge lead (>200). On the other end, Waugh’s leadership saw Australia with maximum inning wins, and Test match getting over inside 4 or less days. Along with this Steve Waugh’s Team holds the record of 16 successive Test win, which no team has ever achieved in any sport.
The other leaders that were extremely successful for Australia and West Indies.


3 Responses to (354)…Factory that produces leaders.