Some people like to rock some people like to roll, but moving and grooving is gonna satisfy my soul!.
Similarly this Ashes series was won by the new ball– “The Chosen Weapon” which moved all the time, and was used effectively by bowlers of both teams.
However it was the experience of English bowlers to control, and use the new ball effectively in condition that suited them more…helped them win the series.
England won the Ashes after annihilating the Australians in the 4th Test.
Here is a stats analysis of both teams.
Batting
Australia scored 2084 (8 inns) 154 runs more than England who batted one less inns(7). In doing so Aussies lost 70 wickets which went @48 balls/per wicket. Almost similar amount of balls English batsmen took to get dismissed (47.62 balls/wicket).
All this suggesting batting was below par – with only 4 (two from each team) centuries so far in this series. However the scoring rate/boundary rate(England superior)were pretty high. England’s boundary rate was 9.71/100 balls against Australia’s 8.71.
Interestingly the Top 3 (openers, and Smith) Aussies scored most of the runs (1135 =(54.46%) of team runs) – compared to English top 4 contribution of only 43.00%.
Openers Chris Rogers(437) and David Warner(333) always gave them a great start(albeit 4th Test) which was followed by not so bad performance by Smith(365)….however the batting hole for Australia began from No 4. 5, and 6 who only gathered 338(20 dismissals) runs averaging 16.90.
This hole led to batting collapse as the ever reliable tail was not able to control the damage, as batting order kept on shifting not allowing the tail to establish their stay in the middle.
For England not surprisingly their top order failed(once again) as none were able to support captain Cook(223) who barely manage to bat long enough(this year, the Avg time spend at the crease is 3 hrs per innings, which has been reduced to less than 2 hrs in this Ashes), and build their innings. Adam Lyth(86) is the fourth Test opener to partner Cook in last 12 months,
Yet it was the man in form Joe Root now batting at No.4(443)managed to control the damage, and steer England from troubled waters. Than luckily for England their late middle order, the likes of Moeen(228),Broad(123) and Stokes(186) to some extent, accumulated enough quick runs to establish a decent yet healthy score(albeit Lord’s 2nd innings)
The New Ball
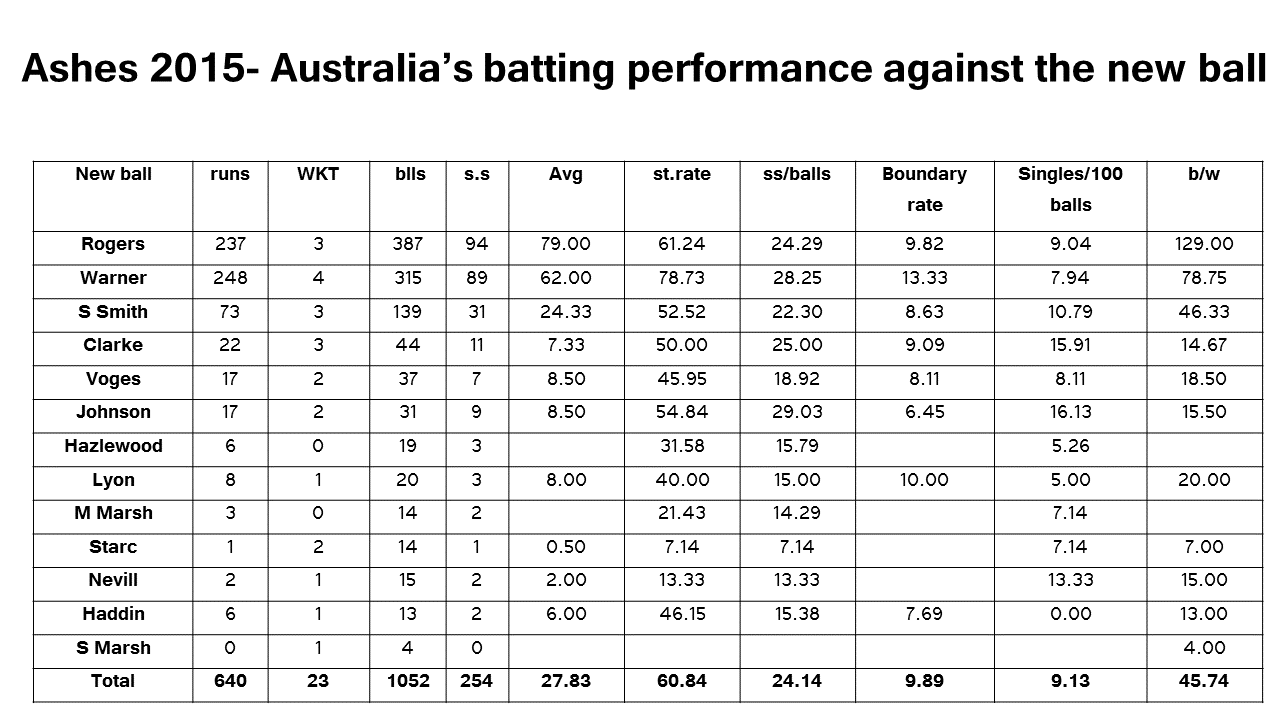
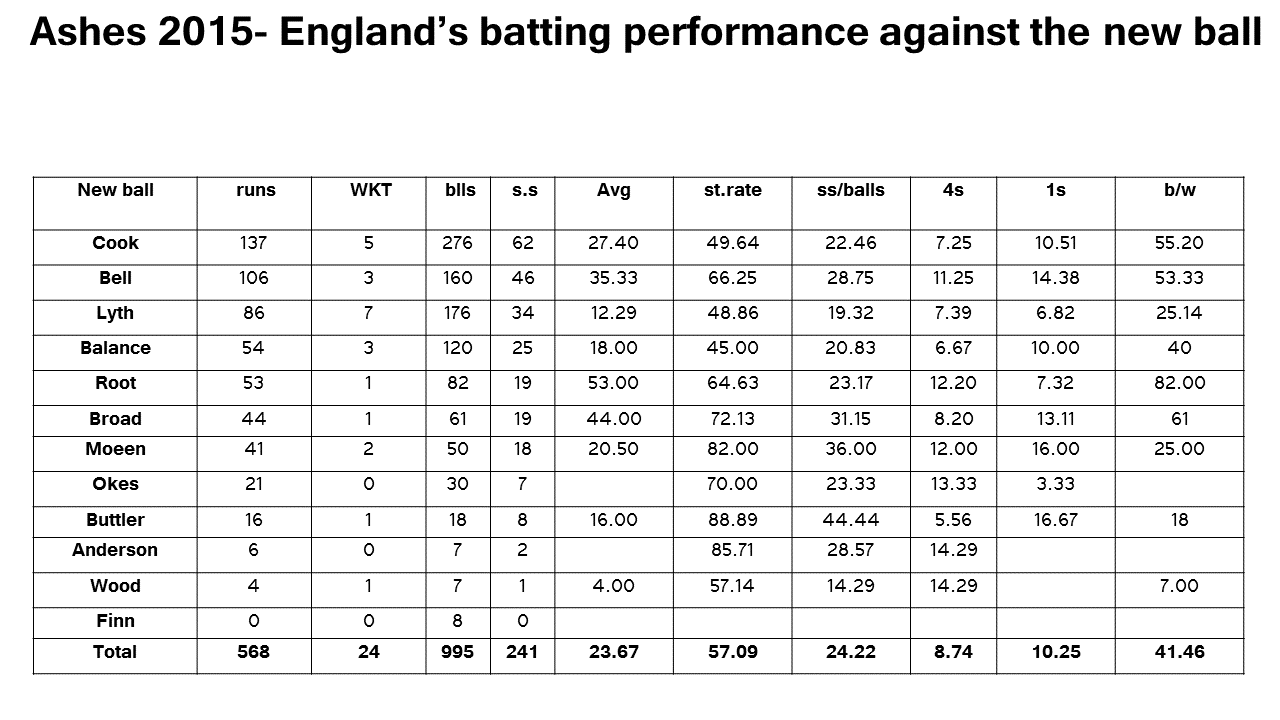
However the X factor of this series was the the new ball!. It produced maximum wickets(35.90%) in this series. England lost 39.34% of their wickets to the new ball, whereas Australia lost 32.85% of their wickets. Clearly suggesting the new ball doing the maximum damage.
Here is a Batsmen’s performance with the new ball*.
*Note: for this analysis I have calculated total of only 30 overs(of two phases) of new ball of each innings by both teams.
a) new ball at the start of an innings from 0-20 overs. Here i believe in English condition the ball remains new till the 20th over, hence took the liberty of measuring first 20 overs of an inning.
b) Second new ball taken after the 80th over. Here i have only measured 10 overs of the second new ball.
Suggesting 30 overs of batting (20 upfront and 10 later ) produced 35.87%(47/131) of total wickets that fell in this series…and if i have to filter the start of the innings(0-20 overs) than 39/131 wickets went to the first new ball!.
The below table displays team’s performance against the new ball, and by using(touch)the Thinglink application the overall runs will be displayed of each batsman.
Partnerships
Interestingly both teams manage to post 3(only) hundred plus partnerships. It clearly suggests the lack of patience to accumulate runs.
For Australia it was a shocking display of poor performance from their middle order, especially after getting a rousing start in almost every inning (see avg below). Michael Clarke the captain tried hard but failed to score substantial runs(117)in return.
His role-play(sum of partnerships) of 284 runs, clearly suggests that he needs to play with freedom. Due to his inability to take control of the innings, Australia lost their way, as wickets fell consistently. The inexperienced middle order could not take advantage of a fairly experienced tail to post challenging total!.
Here is a partnerships stats table and gfx
The Batting average of each partnerships for both teams.
| Partnerships | Eng | Australia |
| I | 14 | 56.88 |
| II | 25.40 | 70.40 |
| III | 43.80 | 22.30 |
| IV | 73.30 | 17.60 |
| V | 49.70 | 18.90 |
| VI | 23 | 27.90 |
| VII | 22 | 14.00 |
| VIII | 36.83 | 34.28 |
| IX | 19.71 | 10.00 |
| X | 4.80 | 10.33 |


