Regressive Momentum
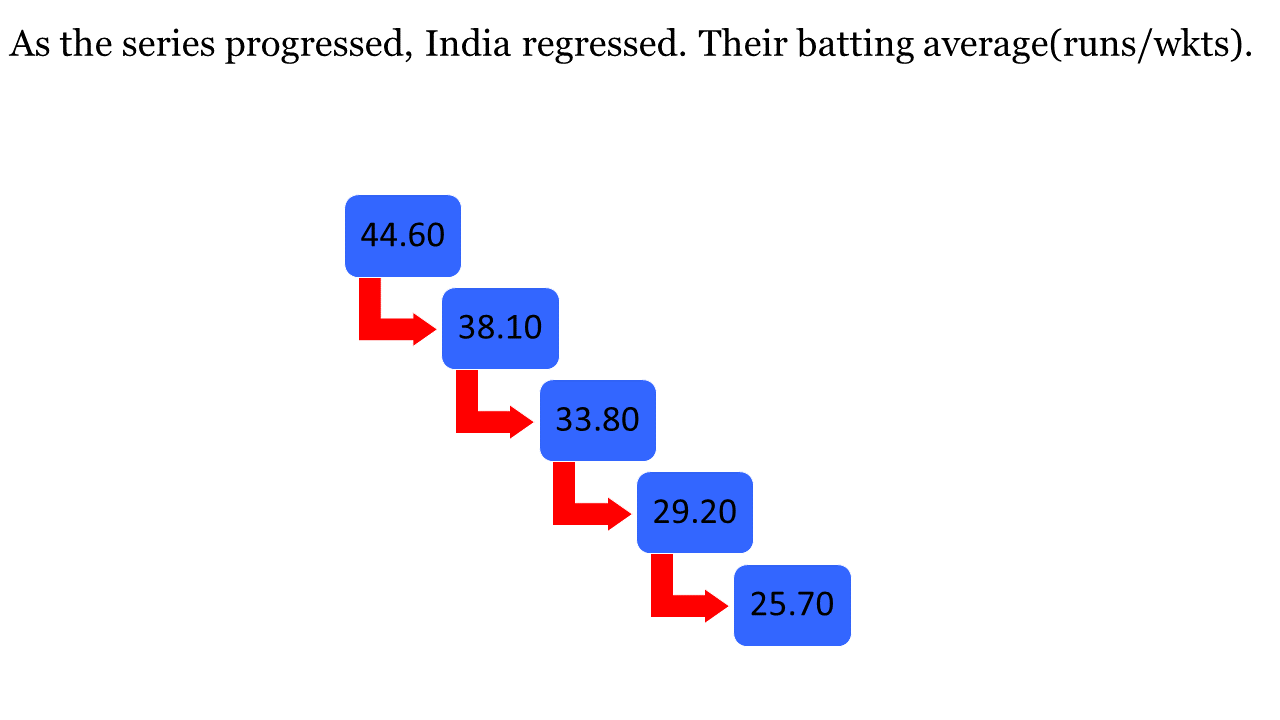
At end of 1st Test both teams were at par with each other in terms of performance. This changed at end of 2nd Test when India found gap in primary indicator in statistics as they won historic Lord’s Test. Although India’s Bat Avg fell from 44 to 38(39wkts/1485 runs), yet it didn’t allow England to take control, they lost the chase and collapsed on last day of 2nd Test.
After this things changed for both teams. India regressed and England climbed dourly. They both had top order batting problems to solve. India’s problem went unnoticed, but host had their captain out of form. The media and ex-players were comparing his conservative batting with his leadership. His lack of tactical acumen on the field was question after one loss. I personally believe a captain is as good as his team, and if he is able to get the best out of his players, extract every ounce of their game, than I think he is good enough to lead. Cook is a fine leader, much better than his predecessors.
On the other hand India looked happy bunch after historic win. However their problem is at a macro level. Instead of producing quality facility/pitches at home, they are taking easy route to success.
Having said this, they picked a quality squad for this tour, covering all areas. Picking tall seam bowlers so that they can get good training/practice against similar kind of bowlers in England. Their batting had enough bench strength, wrapping the top and middle order. And lastly picking spinners who are economical, as for them this seems much better bet than picking someone who concedes more, and if they are lucky to defend and bowl on last day, than spinners who concede less are more effective than others.
Interestingly both teams regressed after the 2nd Test, their primary indices points fell considerable. England gradually climbed with resilient batting, and as they grew in confidence their run-rate post 25 overs increased. Resulting in higher scoring rate.
After the 3rd Test there was 10 point gap between England and India in Bat average (runs/wkts) & B/W(balls per wicket). Suggesting Indian batsmen failed to bat for long, hence unable to post big score, on the other hand England manage to maintain their longevity at the crease, as well increase their run rate.
Here is how both teams progressed or regressed with their primary indicators after each Test.
| England | Inns | Runs | wkts | Avg | B/w | Scoring rate | Boundary rate |
| 1st Test | 1 | 496 | 10 | 49.6 | 86.9 | 20.00/100balls | 6.4/100balls |
| 2nd Test | 3 | 1038 | 30 | 34.6 | 67.8 | 20.6/100balls | 5.8/100balls |
| 3rd Test | 5 | 1812 | 41 | 44.2 | 79.5 | 23.7/100balls | 6.7/100balls |
| 4th Test | 6 | 2179 | 51 | 42.7 | 76.3 | 23.9/100balls | 6.8/100balls |
| 5th Test | 7 | 2665 | 61 | 43.7 | 74.1 | 24.9/100balls | 7.3/100balls |
| India | Inns | Runs | wkts | Avg | B/w | Scoring rate | Boundary rate |
| 1st Test | 2 | 848 | 19 | 44.6 | 89.7 | 22.6/100balls | 6.8/100balls |
| 2nd Test | 4 | 1485 | 39 | 38.1 | 73.7 | 22.5/100balls | 7.00/100balls |
| 3rd Test | 6 | 1993 | 59 | 33.8 | 66.3 | 21.8/100balls | 6.7/100balls |
| 4th Test | 8 | 2306 | 79 | 29.2 | 56.3 | 21.8/100balls | 6.9/100balls |
| 5th Test | 10 | 2548 | 99 | 25.7 | 50.4 | 21.4/100balls | 6.7/100balls |
Scoring rate (scoring shots/100 balls) in each phase(10 over) of an innings.
As we clearly knew when the momentum changed for both teams. Therefore let us see their scoring rate pattern(scoring shots/100 balls)as the series progressed.
England usually start their innings slowly, and this didn’t change when the series started. They were always content with slow start in first two phases (0-20)overs of their innings, but this time after loss at Lord’s Test, they increased their scoring rate after the 10th over, hitting more boundaries in the process. It reflects clearly in their overall scoring rate, from 20.00/100 balls in 1st Test it climbed to 25.00/100 balls at end of the series.
India overall scoring rate/innings remained constant, but they regressed consistently in each phase of their innings.
In first phase it fell from 26 to 16 and it continued in second phase. Nevertheless after the 25th over the rate remained constant throughout the series…but never increased to be level with England.
Here is a look at average scoring rate at each phase(10 Over) as the series progressed.
| England | S S/100 balls | 10th | 20th | 30th | 40th | 50th | 60th | 70th | 80th | 90th | 100th |
| 1st Test | 20.00 | 16.70 | 18.30 | 16.70 | 18.30 | 30.00 | 16.70 | 18.30 | 31.70 | 31.70 | 30.00 |
| 2nd Test | 20.6 | 15 | 16.70 | 19.40 | 15.60 | 23.90 | 17.80 | 20.00 | 32.80 | 25.30 | 28.30 |
| 3rd Test | 23.7 | 16.30 | 23.30 | 23.70 | 24.30 | 25.60 | 19.60 | 21.30 | 28.30 | 22.60 | 27.80 |
| 4th Test | 23.9 | 17.20 | 22.50 | 24.20 | 23.60 | 24.20 | 22.00 | 22.30 | 26.30 | 24.50 | 28.80 |
| 5th Test | 24.9 | 17.40 | 22.90 | 23.80 | 23.10 | 24.00 | 21.70 | 23.10 | 26.70 | 23.70 | 29.30 |
| India | S S/100 Balls | 10th | 20th | 30th | 40th | 50th | 60th | 70th | 80th | 90th | 100th |
| 1st Test | 22.6 | 25.80 | 22.50 | 17.50 | 22.50 | 21.50 | 18.30 | 22.50 | 25.80 | 21.70 | 22.50 |
| 2nd Test | 22.5 | 19.60 | 19.60 | 20 | 21.70 | 19.25 | 20.40 | 20.80 | 27.90 | 30.00 | 28.30 |
| 3rd Test | 21.8 | 17.80 | 19.20 | 21.10 | 22.60 | 19.33 | 21.10 | 21.90 | 25.70 | 28.30 | 25.80 |
| 4th Test | 21.8 | 16.30 | 19.60 | 21.70 | 22.90 | 20.01 | 21.10 | 21.90 | 25.70 | 28.30 | 25.80 |
| 5th Test | 21.4 | 16.50 | 18.80 | 21.00 | 23.00 | 19.61 | 21.20 | 22.10 | 25.70 | 28.30 | 25.80 |
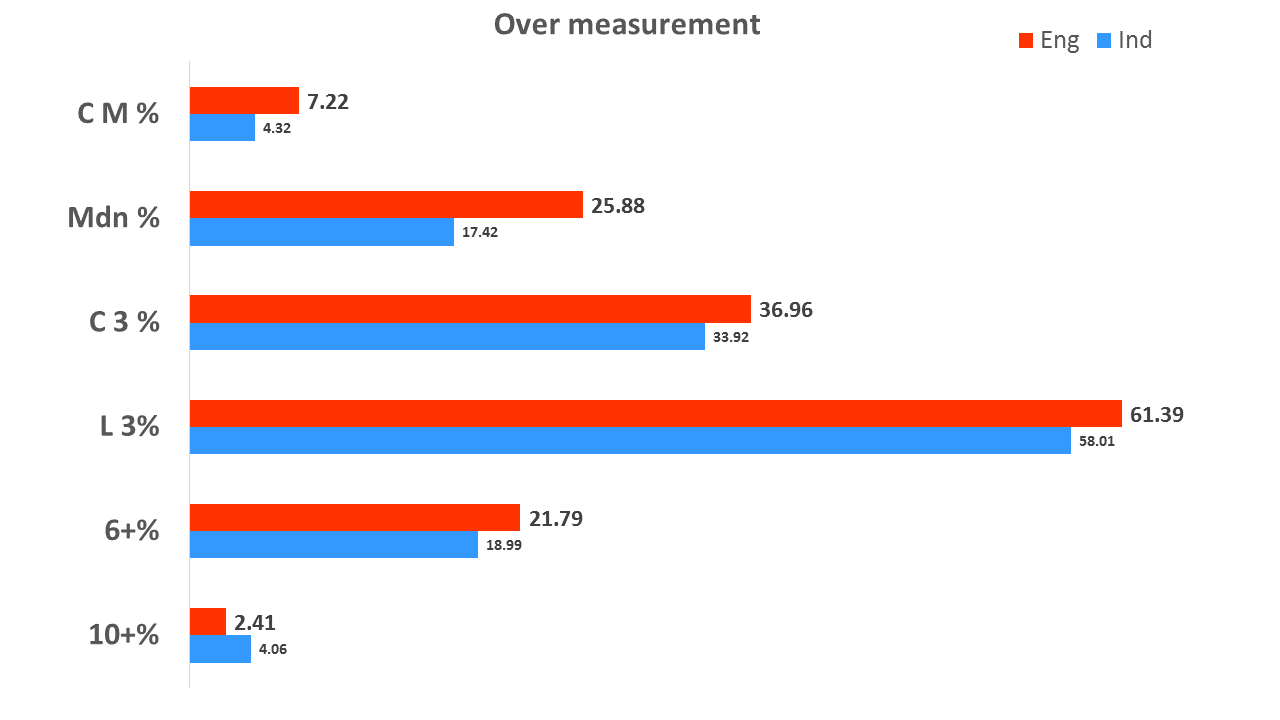
Over measurement
Fascinatingly as far economic rate is concerned Indian bowlers bettered their eco rate as the series progressed. They increased their % of maidens(from 13 to 17) as well sustained rest of “over measurement”.
England too did the same, but it was “big overs” which they arrested drastically (from 29 to 22). Interestingly at end of 2nd Test,English bowlers conceded 25.00% >6 runs/overs compared to India’s 14.49% but gradually it got reduced for England, and India’s big over increased somewhat.
Here is progression/regression chart of “Over measurement”
| England | Inn | Overs | % Mdn | % C 3 | % L 3 | % 6+ |
| 1st Test | 2 | 284 | 22.89 | 36.27 | 61.27 | 28.87 |
| 2nd Test | 4 | 478.5 | 24.45 | 35.95 | 60.19 | 25.08 |
| 3rd Test | 6 | 651.4 | 25.19 | 37.33 | 61.29 | 22.58 |
| 4th Test | 8 | 741.2 | 25.39 | 36.20 | 60.51 | 22.83 |
| 5th Test | 10 | 831.5 | 25.88 | 36.96 | 61.39 | 21.79 |
| India | Inn | Overs | % Mdn | % C 3 | % L 3 | % 6+ |
| 1st Test | 1 | 144.5 | 13.15 | 31.83 | 57.44 | 20.76 |
| 2nd Test | 3 | 339 | 18.92 | 40.21 | 63.28 | 14.49 |
| 3rd Test | 5 | 543.2 | 18.63 | 36.16 | 59.59 | 17.90 |
| 4th Test | 6 | 648.5 | 18.38 | 35.69 | 59.32 | 18.23 |
| 5th Test | 7 | 753.5 | 17.42 | 33.92 | 58.01 | 18.99 |
These are few graphic based analysis on the series for both teams
1- Average and percentile of primary indicators

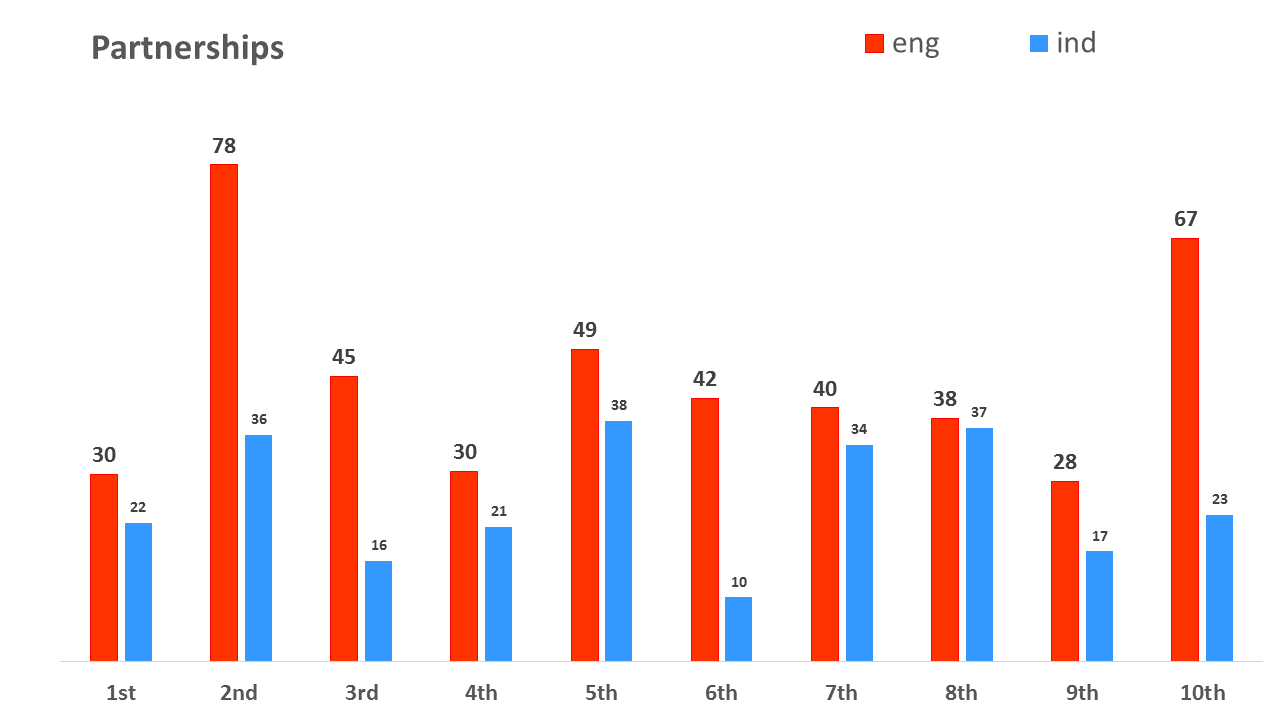
2- Batting partnerships
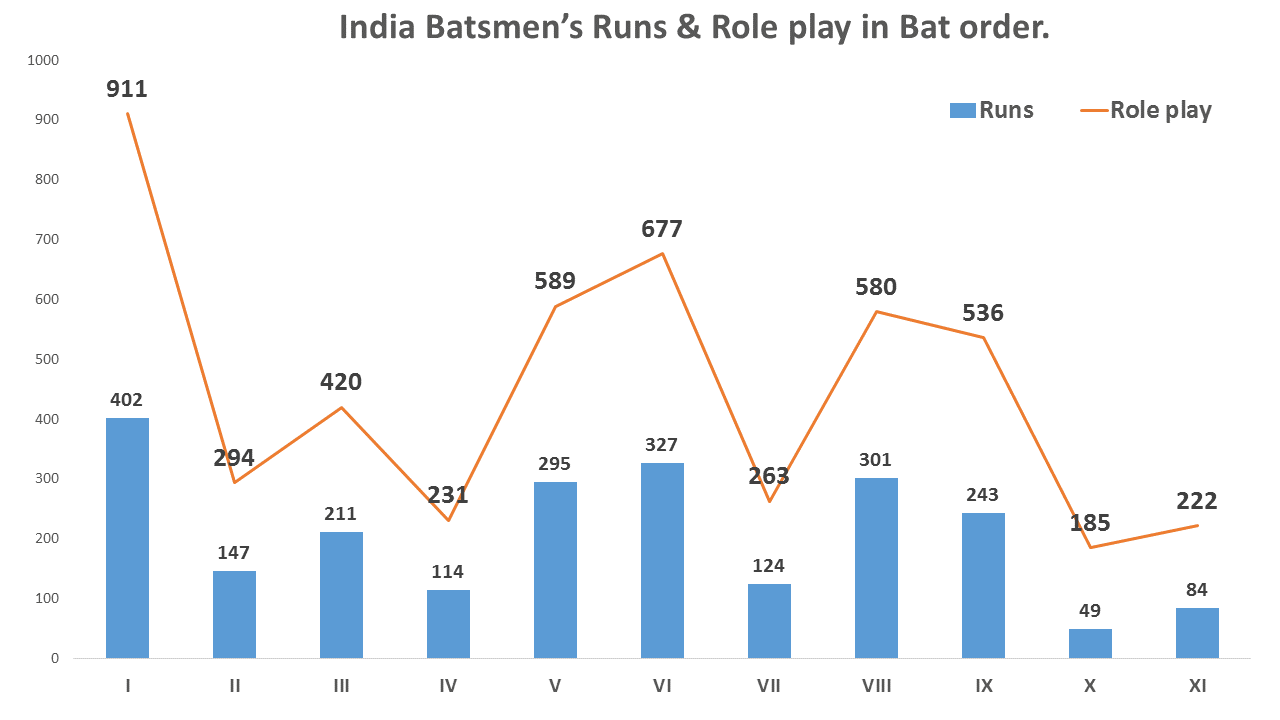
3- Runs with Role play for each batting position

4- Over measurement
5- India’s regression
Here is a link to meaning of all indicators/formula –
http://allthatcricket.com/?p=1489
