New Zealand Performance Review
This might sound inappropriate but New Zealand team were lucky to be in the semi-finals!.
As the tournament progressed their NNR (Net run rate)was going down. This along with their batting strike rate and boundary rate. It was after their close win against West Indies things started to slide down for them. Their bowling too was effected, as their RUN-RATE fluctuated, scoring rate started to rise.
One might argue that teams do tend to taper their performance at end of tournament, or those who start with great form tend to dip towards the end of the tournament. However apart from New Zealand it didn’t not happened to England, India or Australia. For NZ it was a sharp fall. Hence they were lucky to be in semi-finals!!.
I have split the below stats in two tables :
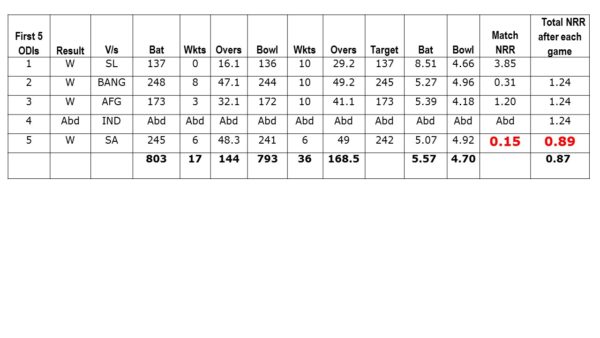
- First 5 games (one was abandoned)
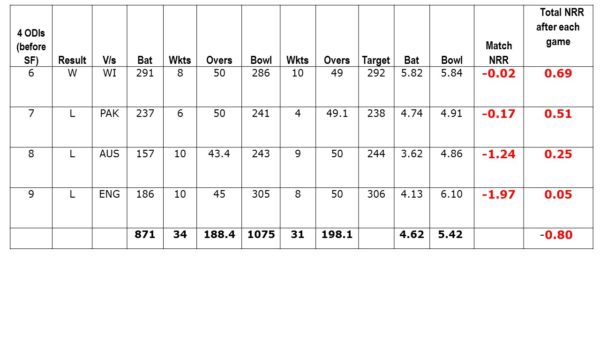
- Subsequent 4 games (before qualifying for SF)
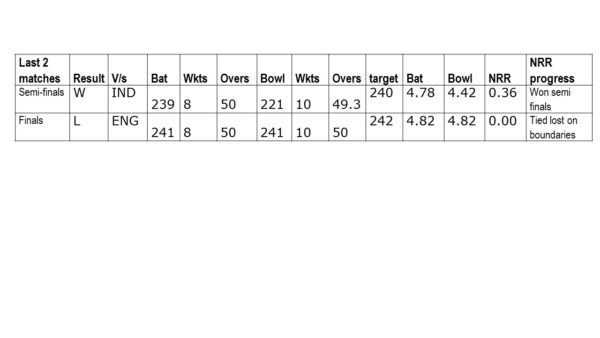
Here is match-wise list of their performance.
Here is their KPI of these two phases of their WC
| First 5 games | Batting Indicators | Subsequent 4 games (before qualifying for SF)
|
| 5 | Mts | 4 |
4 |
Won |
1 |
| 0 | Lost | 3 |
| 1 | Abandoned | 0 |
| 803 | Runs | 871 |
| 17 | Wkts | 34 |
| 144 | Overs | 188.4 |
47.24 |
Avg |
25.62 |
5.59 |
R/o |
4.36 |
51.00 |
St.Rate |
33.29 |
| 48.79 | Scoring rate | 43.99 |
| 32.76 | Singles | 31.18 |
| 38.18 | Lesser | 37.37 |
| 10.61 | Boundary rate | 6.63 |
| 1.39 | % Mdn | 5.31 |
| 37.6 | % L 4 | 58.92 |
| 15.32 | % C 4 | 36.62 |
| 18.11 | % C 6+ | 11.68 |
| 43.87 | % 6+ | 31.85 |
…here is how batsmen performed in these two periods.
Apart from Martin Guptill, even batsmen like Grandhomme, Latham, and Nicholls failed to deliver in both phases.
| Batsmen | Tournament | Ins | Runs | Balls | Runs/inns | Scoring rate/100 balls | Boundary rate/100 balls |
| Williamson | First 5 games | 4 | 225 | 310 | 56.25 | 47.42 | 6.45 |
| Williamson | Next 4 games | 4 | 256 | 313 | 64.00 | 46.96 | 8.31 |
| Guptill | First 5 games | 4 | 133 | 125 | 33.25 | 47.20 | 15.20 |
| Guptill | Next 4 games | 4 | 33 | 65 | 8.25 | 26.15 | 6.15 |
| R Taylor | First 5 games | 4 | 131 | 146 | 32.75 | 50.00 | 10.96 |
| R Taylor | Next 4 games | 4 | 130 | 200 | 32.50 | 43.50 | 5.50 |
| C Munro | First 5 games | 4 | 113 | 110 | 28.25 | 48.18 | 15.45 |
| C Munro | Next 4 games | 2 | 12 | 18 | 6.00 | 27.78 | 11.11 |
| Grandhomme | First 5 games | 4 | 75 | 62 | 18.75 | 61.29 | 14.52 |
| Grandhomme | Next 4 games | 4 | 83 | 93 | 20.75 | 49.46 | 9.68 |
| Neesham | First 5 games | 4 | 48 | 69 | 12.00 | 39.13 | 8.70 |
| Neesham | Next 4 games | 4 | 153 | 184 | 38.25 | 52.72 | 5.98 |
| Latham | First 5 games | 4 | 14 | 27 | 3.50 | 40.74 | 3.70 |
| Latham | Next 4 games | 4 | 84 | 123 | 21.00 | 47.97 | 4.07 |
| Santner | First 5 games | 4 | 19 | 17 | 4.75 | 64.71 | 11.76 |
| Santner | Next 4 games | 4 | 39 | 69 | 9.75 | 31.88 | 4.35 |
| Nicholls | First 5 games | Dnp | Dnp | Dnp | Dnp | Dnp | Dnp |
| Nicholls | Next 4 games | 2 | 8 | 20 | 4.00 | 10.00 | 10.00 |
Team bowling analysis
| First 5 games | Bowling Indicators | Subsequent 4 games (before qualifying for SF)
|
| 5 | Mts | 4 |
| 4 | Won | 1 |
| 0 | Lost | 3 |
| 793 | Runs | 1075 |
| 36 | Wkts | 31 |
| 22.03 | Avg | 34.68 |
| 3.98 | R/o |
5.40 |
| 28.25 | St.Rate | 38.35 |
| 41.00 | Scoring rate | 45.67 |
| 27.43 | Singles | 28.85 |
| 32.84 | Lesser | 35.07 |
| 8.16 | Boundary rate | 10.60 |
| 4.75 | % Mdn | 2.52 |
| 52.82 | % L 4 | 46.44 |
| 29.67 | % C 4 | 22.72 |
| 8.30 | % C 6+ |
18.17 |
| 30.86 | % 6+ | 41.39 |
Here is how their bowlers started being less effective…
Interestingly we can see inconsistency bowling from their strike bowlers, but lot of consistency showed by non-regular ones. For instance Ferguson being their strike bowler had a great first 5 games, compare to his next 4 games… and for Boult it was the opposite.
| Bowling | Tournament | Inns | Balls | Runs | Wkts | R/o | %mdn | % C 4 | % L 4 |
| Ferguson | First 5 games | 4 | 215 | 158 | 11 | 4.41 | 8.37 | 33.49 | 58.60 |
| Ferguson | Next 4 games | 3 | 170 | 158 | 6 | 5.58 | 0 | 17.65 | 35.29 |
| Boult | First 5 games | 4 | 235 | 185 | 4 | 4.72 | 0 | 35.74 | 43.40 |
| Boult | Next 4 games | 4 | 240 | 185 | 11 | 4.63 | 5 | 20.00 | 50.00 |
| Grandhomme | First 5 games | 4 | 144 | 100 | 4 | 4.17 | 4.17 | 45.83 | 62.50 |
| Grandhomme | Next 4 games | 4 | 90 | 74 | 1 | 4.93 | 6.67 | 6.67 | 40 |
| M Henry | First 5 games | 4 | 205 | 160 | 7 | 4.68 | 5.85 | 23.41 | 52.68 |
| M Henry | Next 4 games | 3 | 156 | 155 | 3 | 5.96 | 0.00 | 26.92 | 50 |
| Neesham | First 5 games | 3 | 91 | 76 | 6 | 5.01 | 6.59 | 26.37 | 52.75 |
| Neesham | Next 4 games | 4 | 149 | 124 | 5 | 4.99 | 4.03 | 32.21 | 48.32 |
| Santner | First 5 games | 3 | 126 | 91 | 3 | 4.33 | 4.76 | 28.57 | 71.43 |
| Santner | Next 4 games | 4 | 198 | 187 | 1 | 5.67 | 5.67 | 24.24 | 51.52 |
| Williamson | First 5 games | DNB | DNB | DNB | DNB | DNB | DNB | DNB | DNB |
| Williamson | Next 4 games | 2 | 90 | 64 | 2 | 4.27 | 4.27 | 26.67 | 66.67 |
Statistical Analysis
ODIs – 11
Won – 6
Lost – 4 (including tied match)
Abandoned -1
KPI comparison of (WC-2019) v/s Recent(pre WC -2019)
Below table clearly suggests their batting dropped considerably. This is due to the fact all their 2019 matches before WC was played at home!.
Here is comparison of their WC 2019 Performance v pre WC 2019 performance.
| World Cup 2019 | Pre World Cup (in 2019 ) | |||
| Batting | Bowling | Indicators | Batting | Bowling |
| 32.42 | 27.13 | Avg | 39.86 | 29.63 |
| 4.95 | 5.01 | R/o | 5.96 | 5.36 |
| 39.29 | 32.49 | St. Rate | 40.10 | 33.15 |
| 45.86 | 43.05 | Scoring Rate | 52.06 | 44.54 |
| 7.89 | 9.07 | Boundary rate | 10.90 | 10.07 |
| 51.77 | 51.32 | L 4 | 44.89 | 41.90 |
| 37.01 | 35.97 | 6 + | 15.18 | 13.02 |
10-over phases(bat v bowl)
Here is a 10-over breakdown on their batting and bowling progress. Featuring 6 indicators, including exclusively 6 plus R/o for batting and L 4(4 or less R/o) for bowling.
If we look at their overall performance (11 games ) then their bowling was decent, but it was their batting that never took off!.
| Batting | Wkts | Avg | R/O | St.Rate | Scoring Rate | Boundary rate | % 6 + R/o | % < =4 R/o |
| (0-10) | 14 | 28.29 | 4.40 | 38.57 | 33.33 | 9.63 | 31.11 | 58.89 |
| (11-20) | 8 | 49.00 | 4.53 | 64.88 | 44.32 | 6.74 | 27.75 | 60.12 |
| (21-30) | 5 | 76.80 | 4.79 | 96.20 | 49.90 | 6.24 | 38.67 | 51.14 |
| (31-40) | 13 | 26.15 | 4.70 | 33.38 | 48.62 | 6.22 | 35.94 | 55.30 |
| (41-50) | 19 | 21.11 | 7.31 | 17.32 | 61.40 | 11.85 | 62.01 | 25.53 |
| Bowling | Wkts | Avg | R/O | St.Rate | Scoring Rate | Boundary rate | % 6 + R/o | % < =4 R/o |
| (0-10) | 14 | 31.00 | 4.82 | 38.57 | 33.15 | 11.67 | 36.67 | 54.44 |
| (11-20) | 13 | 30.54 | 4.41 | 41.54 | 39.26 | 7.78 | 30.00 | 56.67 |
| (21-30) | 16 | 26.50 | 4.73 | 33.63 | 41.26 | 8.18 | 32.34 | 53.53 |
| (31-40) | 11 | 35.73 | 4.92 | 43.55 | 48.02 | 7.31 | 32.57 | 55.11 |
| (41-50) | 23 | 19.17 | 6.53 | 17.61 | 57.78 | 10.62 | 51.85 | 32.59 |
Partnerships Avg(Bat v Bowl) with No.century stands(in bracket)
Batting Partnerships –
Their partnerships revolved around their captain Kane Williamson. He held the fort in every match and almost batted till the end of their innings. His total time at the crease in this WC was for 254.4 (59.02% of team’s total overs) and during that period NZ manage to score 1229 Runs(57.05 % of team’s total runs).
Batting Partnerships against New Zealand
As I mention above their overall performance slipped. Teams started posting substantial total before SF and that is due to some 100 plus partnerships from top order. Interestingly though, of these 6 century stands none came in first 5 games (SL, BAN, AFG & SA) and 4 came in next 4 games, and then 1 each in semis, and finals.
| Batting | WC – Partnerships | v/s New Zealand |
| 29.80 (1) | 1st wkt | 31.60 (1) |
| 57.22 (1) | 2nd wkt | 27.50 |
| 43.22 (1) | 3rd wkt | 32.20 (1) |
| 17.13 | 4th wkt | 28.00 (1) |
| 33.25 | 5th wkt | 35.80 (1) |
| 44.25 (1) | 6th wkt | 21.11 (1) |
| 11.75 | 7th wkt | 34.89 (1) |
| 7.83 | 8th wkt | 13.13 |
| 7.20 | 9th wkt | 11.63 |
| 9.00 | 10th wkt | 11.00 |


2 Responses to (570)…CWC2019 Team Review – New Zealand