[quads id=1]
12 Mar / 2019(557)…(ODI-2019)The gap factor, a difference in winning and losing
At end of 31 ODIs
The format of forthcoming World Cup is based on each team playing against each other, with top 4 participating in semi-finals. So far 31 matches are played and no team has total advantage or have dominated their series with only 20 % closely fought!.
Team’s success in brief
- India won 8 games – 5 chasing and 3 defending. Only once a score of 300(bat or bowl) was crossed in their wins!.
- New Zealand won 7 games – defended huge score in 4 games and successfully chased(3) small total with great ease. All their wins were convincing.
- South Africa won 6 games – defending 2, and chased down 4 matches comfortably. They all were less 250 runs!.
- Australia won 3 games – all against India, with one historic chase of 359 and two were while defending big totals.
- Pakistan won 2 games – both were easily chased(267 & 168) v/s South Africa
- England won 2 games – defending (418) and chasing(364) mammoth totals v/s WI!.
- West Indies won 2 games – both were convincing win v/s England
- Sri Lanka(6 ODIs) and Bangladesh(3 ODIs) are yet to win a ODI match this year!.
From above stats it is very clear that there is no conclusive evidence of which team is dominating!.
Therefore to find winning formula accurately one can use gap factor using various indictors, and then use them in specific segments(1st bat, 1st bowl, 2nd bat, 2nd bowl, phases and other relevant factor). At the moment all teams have not played equal No. of games to be compared against each other. Perhaps it might not be necessary if we can find the difference in winning and losing across primary indicators of each team.
For instance let us take one basic indicator – R/o to find the difference.
Table 1- Gap factor
Below table is total ODIs played by all test playing nation(excluding Afghanistan and Ireland).
So far New Zealand have the best gap factor – although their batting run rate is not as good as other teams but when their bowling run rate is much lesser then most teams, which gives them a gap of 0.60(see win factor). However they lost poorly to India, who now are slightly conceding more than they are acquiring.
Interestingly there are fewer teams that have run rate of over 6 – however there are more teams who conceded 6.00!.
Teams with 6 plus run-rate are NZ(5.96), WI(7.15), and ENG(6.63) with West Indies being the best.
Nevertheless while bowling teams like England(7.15), WI(6.63), BAN(6.05) and SL (6.56) have conceded > 6.00, with South Africa having the lowest run rate at 5.10!.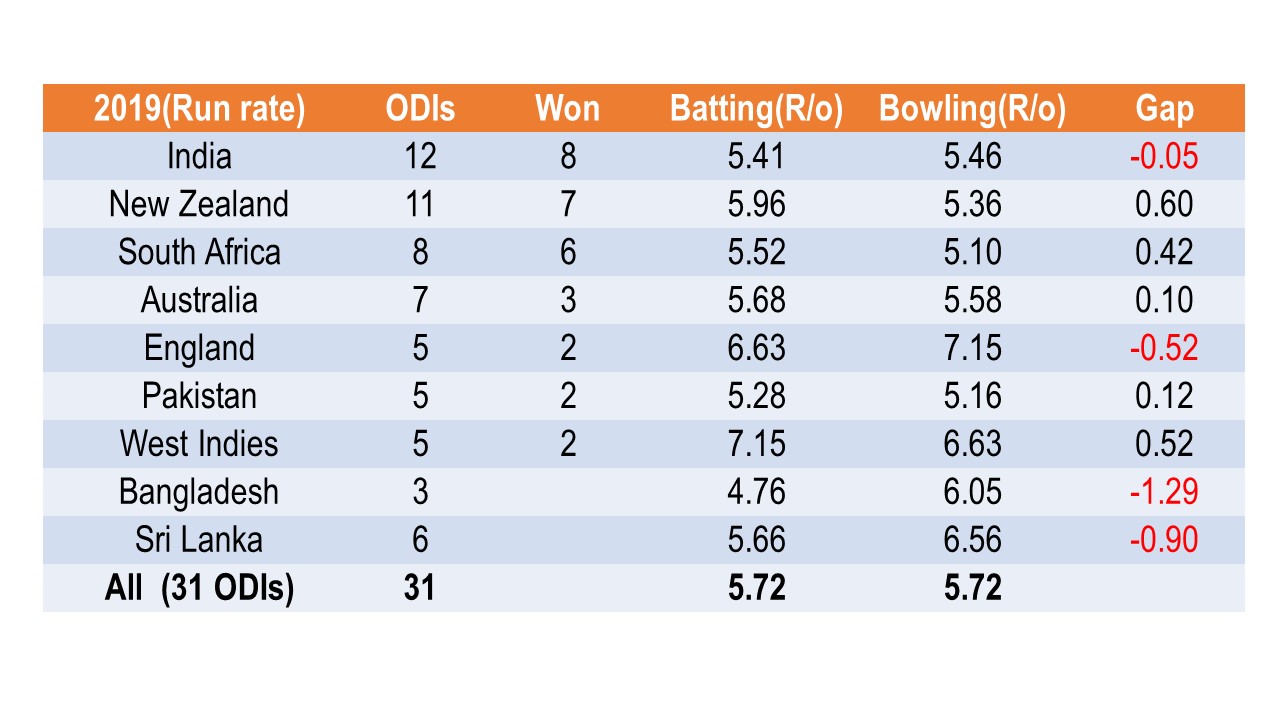
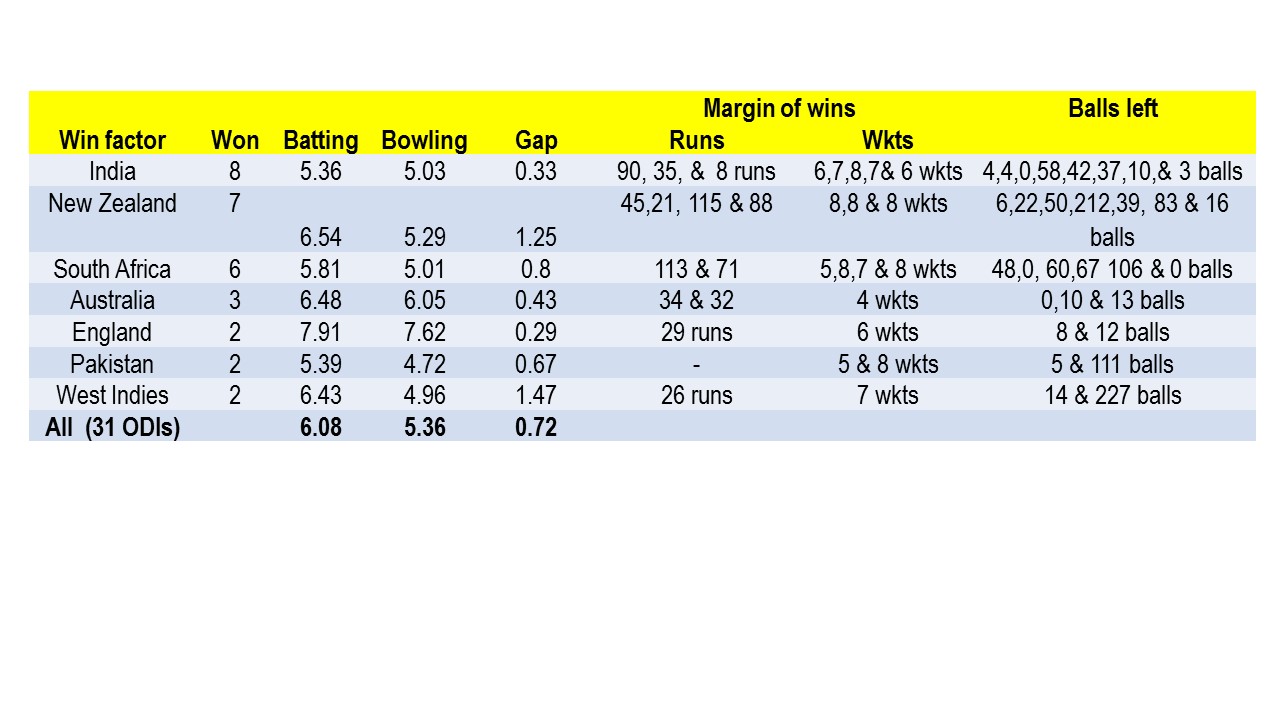
Table 2- Win Factor(Gaps)
Below table is run-rate of teams when they win matches. Here also New Zealand is leading the table in terms of gap factor. When they win their batting run rate is 6.54 v bowling rate of 5.29!. –
Interestingly West Indies have won only 2 games but have huge gap in batting v bowling run-rate.
India so far have won the maximum ODIs this year.
SHARE:


2 Responses to (557)…(ODI-2019)The gap factor, a difference in winning and losing