Is Australia’s 50-over domestic tournament JLT, a proxy practice for next year’s World Cup ?
Last year Western Australia won the JLT trophy convincingly. They had a great start to the tournament and never lost their momentum. However this year, inspite winning more games than any team, Western Australia didn’t qualify in the finals. Interestingly it was Victoria who had won less games than WA, won the tournament beating Tasmania by 110 runs in the finals.
I was not able to cover ball 2 ball data – but over-by-over data of all games was updated. Hence individual batsman’s performance will be missed out.
However we can look at bowler’s analysis – It would be interesting reflection if we were to compare these domestic performance against One Day Internationals for Australian bowlers.
This year the tournament was played with one less team- viz 6 teams.
Last year seven teams took part in this tournament, CA (Cricket Australia) was the seventh team, which was omitted this year. Hence only 6 state teams participated in 20- game tournament (including finals)this year. This format was played with each team playing one game against each other in 7 allotted venues.
Team Batting
From data I collected – I felt in first innings teams were trying very hard to score big total in less overs. In doing so, 60%(12/20) of them were not able to bat out(all out)quota of 50-overs, including 2 teams who lost their 10th wkt on last ball of their innings. Victoria, this year’s winner were involved in 5 games in which they lost all 10 wickets(all out).
For the record, last year only 3 teams(3/23= 13.04%) were all out (10 wkts) in first innings !.
Of 20 games, 19 had results and one was abandoned.
Win-margin – 19 matches (one-sided)
From Win-Margin one can easily say there were no close games. and result in 13 games had huge margin, with one game was decided by Duckworth and Lewis.
Below is Win-Margin in 19 successful games (one was abandoned)
- Winning by > 50 runs : 31.58%( 6/19)
- Winning by > 5 wickets : 36.84%(7/19)
- Winning by > 10 overs remaining : 31.58 (6/19)
1st Batting – 19 Matches (slipping by 40th over)
- > 275 scores – 9 times – 5 wins
- > 300 scores – 6 times – 4 win
- < 250 scores – 8 times – 2 wins
- Margin of win – Winning by > 50 runs : 31.58%( 6/19)
- Margin of win > 5 overs remaining : 21.00% (4/19)
End of 40th over (1st batting)
Teams lost their way in last 10 overs.
- 47.37 %(9/19) times teams lost > 6 wickets at end of 40th over.
- And, only 53% of the times teams were over the 200 run mark at end of 40th over.
Both point suggesting teams didn’t have enough wickets to bat-out their quota of 50-overs.
2nd Batting – 19 matches (No close chase)
While chasing 45% (9/20) were bowled out either before or on the last ball of the stipulated 50-overs. Which is very high compare to last year.
Chasing target range successfully
- Target between 200-225 : 2 times – 2 wins (100.00 %)
- Target between 226-250 : 5 times – 3 wins (60.00%)
- Target between 251-275 : 2 times – No win
- Target between 276-300 : 3 times – 3 wins 100.00%
- Target between 301-325 : 2 times – 1 win 50.00 %
- Target between 326-350 : 2 times – No win
- Target beyond 350 : 2 times – No win
Overs Remaining – games got over before stipulated 50th over
- 52 .63 % (10/19) times games got over with > 5 overs remaining, of which 6 were successful run-chase!
- 10 times(10/19) teams were asked to chase score of 275 or above(4 wins). Of which 5 matches got over with > 5 overs remaining, with 2 successful chase.
- 8 times teams were asked to chase score of less than 250(6 wins), of which 5 matches got over with > 5 overs remaining, with 4 successful chase.
- 7 times(36.84%) teams won with > 5 or wickets remaining, featuring 3 games that were 275 plus targets!.
Toss factor
9 teams(47.37%) won their match after winning the toss (either batting or bowling first)
Win toss and bat
- 9 teams opted to bat after winning the toss – 4 won their games.
- 9 teams opted to bat after winning the toss – of which 4 scored > 275 runs (3 wins, 1 loss)
Win toss and bowl
- 10 teams opted to field after winning the toss – 5 won their games.
- 10 teams opted to field after winning the toss – of which 5 conceded > 275 runs!. (2 wins, 3 loss
Bowling (1st bowling -19 Mts)
- Average score – 275, and nine times(19) they conceded > 275 score!.
- 10 wins / 9 loss -1st bowling – 12 times teams bowled out their opponent.
2nd bowling (19 matches)
- 9 wins for teams that defended (2nd bowling)
- 8 times teams were asked to defend score of < 250, of which they won 2
- 10 times teams were asked to defend a score < 275 of which they won 4
(2017-18 v 2018-19)

An analysis comparison from two seasons(2017-18 & 2018-19)
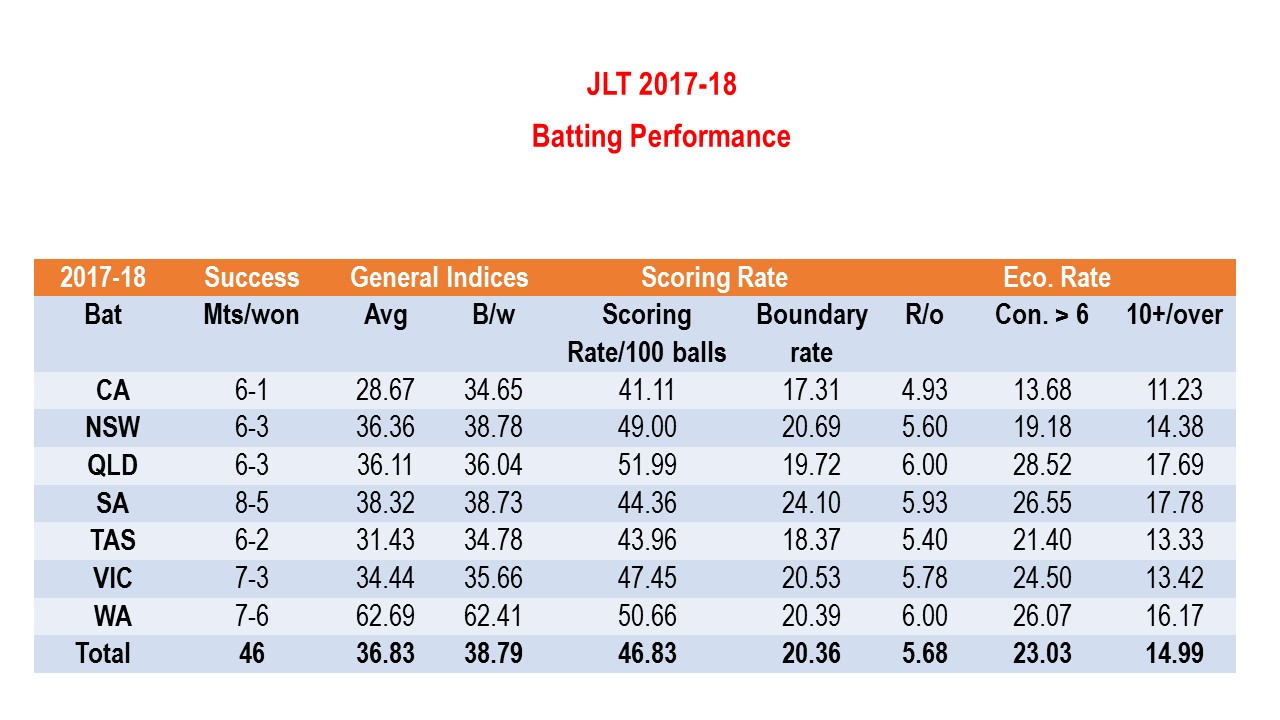
I have used few key indicators that reflects some change in these 2 years.NSW – This season they have batted poorly. Not once they were able to post 250 plus score while batting first- in 3 games they were bundled out before the 50th over with highest score of 241- hence frequency of wicket per balls faced is very low @ 31 – though it didn’t not have major effect on their run-rate
QLD (this season) – apart from first and last game they had excellent batting performance. They were able to reach big score in either innings.
SA- last year’s finalist were not able to perform the same way with the bat. Not a single 300 score this year(last year they had four 300 score while batting first)
TAS – a much balance batting performance this year. However batting folded meekly in the finals.
VIC- this year 6 times they batted first(only once last year) and posted some decent score. Interestingly this year they were the only team to lose all 10 wickets in every game, and there were none last year.
WA -like last year only lost one game - yet could not qualify in the finals. In comparison to last year, they lost too many wickets in first 20 overs – 17(69) compare to 8(40) last year. Always prefer to chase, only they batted first this year. There is great dip in their general indices(Avg Balls/wkt) but their run-rate has been high along with boundary rate, and big overs!!.
 |  |
 |  |
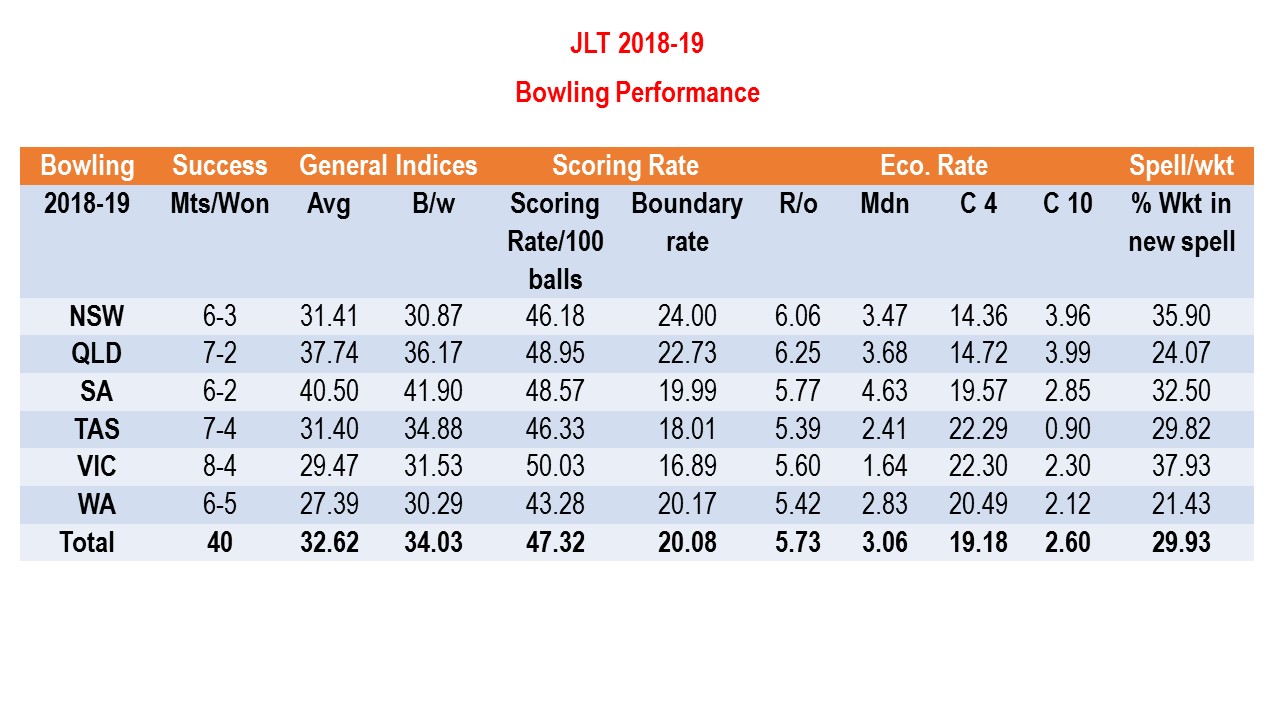
| If we compare last year's bowling performance, Victoria and Tasmania have improved their bowling performance this year. | However others remained same or got worse!. |
 |  |
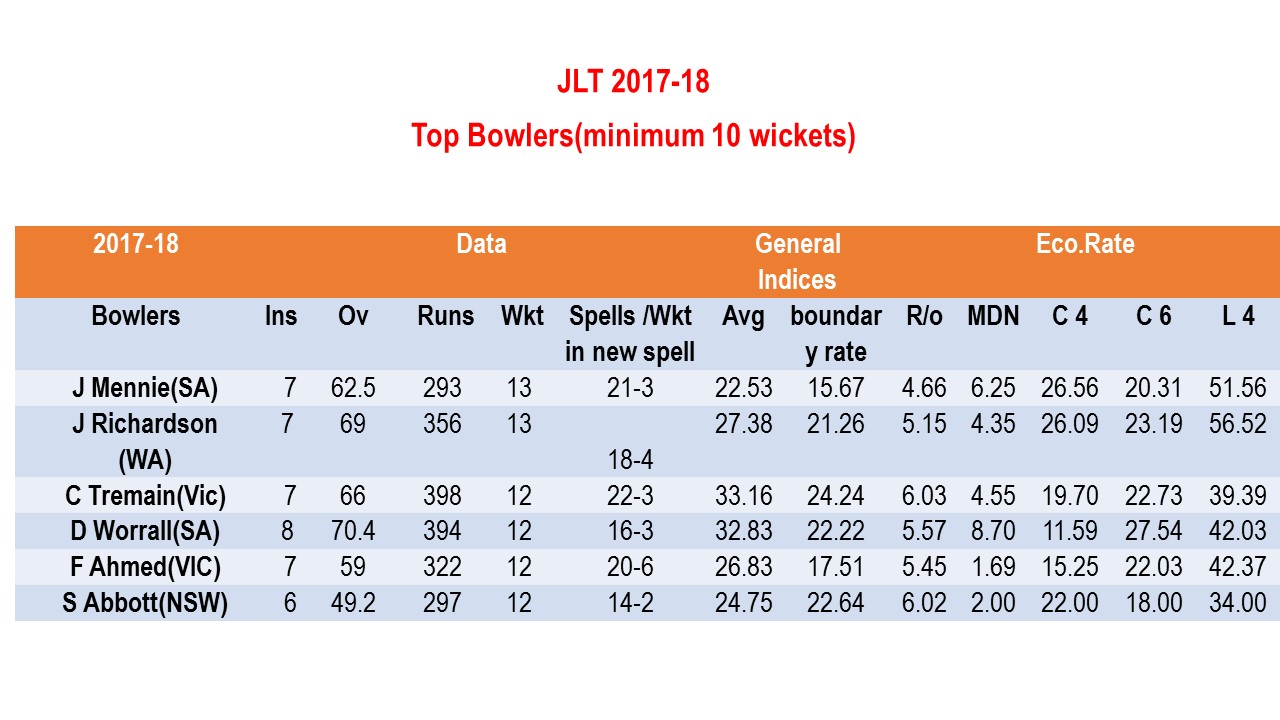
| Below in list of top bowlers there is a interesting pattern, apart from Sean Abbott none of them stayed at the top of most wicket list in two seasons!. | This year, inspite less games, more wickets were purchased by fast bowlers. |
 |  |
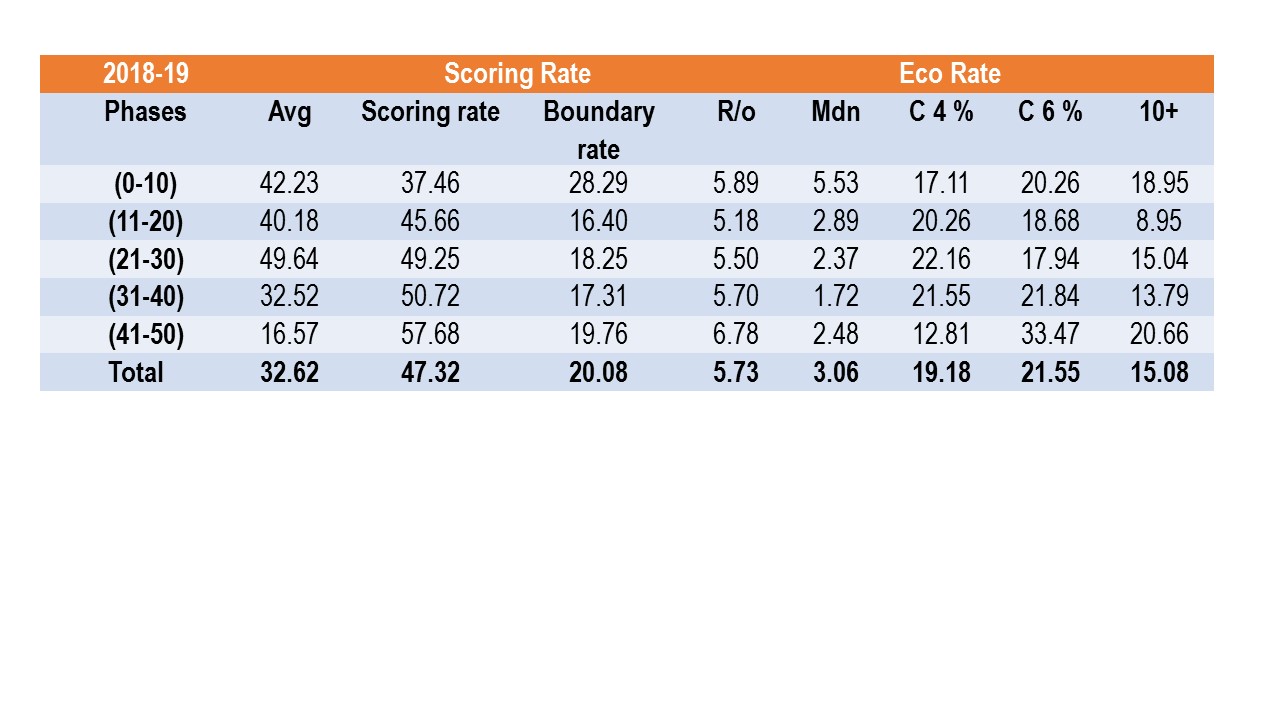
| last year the run-rate increased gradually ending pretty high in last two phases... | However this year, the rate was high from onset and it remained same till teams lost all their wickets in last phase |
 |  |
| Although leg-spinners had the most wickets among spinners,but.. | ..the left arm spinners(orthodox & chinaman) were more economical. |
 |  |
