Looking back in hindsight to the BBL Final, there are sufficient indicators of performance that suggested Perth Scorchers would win. The margin of the win was not as predictable.
With inputs from John Buchanan(buchanancoaching.com) and Keith Lyons(https://keithlyons.me/about/) here is a selection of data that i compiled in order to show that provided you are looking at the right metrics, good prediction is possible.
Contrasting teams prior to the finals, some of the data suggested a very close contest –
- The success of a home win was lowest this year BBL 6. Only 35.29% success for home teams, and was worse when a team batted first 26.32%.
- The Scorchers had the best home record this year, winning 3 out of 5 games not to mention the unquantifiable factor of the home crowd!
- The Sixers had the best away record(including the tied semi-final) winning 4 out of 5 games.
So on paper, the Final loomed as an absorbing contest.
Of course there are other factors such as Sixes travelling to Perth, although their record doing this is not too bad; as well as being involved in a nerve wracking Super Over in Brisbane to qualify.
What does some of the data say –
Batting
| batting average scoring rate = % balls scored off per 100 balls boundary rate = % boundary balls per 100 balls economy sector let us look at difference in % of high scoring overs |
|---|
 |
 |
Best batsman for each over of the tournament
| best for each over | Balls. | Runs | Wk | st.rate | 4/6ss | Consecutive scoring shots |
| 1st over | 444 | 425 | 17 | 95.72 | 13.74 | 4.50 |
| Dunk | 21 | 24 | 1 | 114.29 | 19.05 | 0.00 |
| McCullum | 17 | 31 | 0 | 182.35 | 35.29 | 11.76 |
| Peirson | 26 | 37 | 0 | 142.31 | 26.92 | 3.85 |
| 2nd over | 449 | 575 | 15 | 128.06 | 19.38 | 10.69 |
| D Hughes | 21 | 21 | 0 | 100.00 | 9.52 | 14.29 |
| Dunk | 20 | 43 | 0 | 215.00 | 35.00 | 30.00 |
| Finch | 25 | 40 | 0 | 160.00 | 20.00 | 20.00 |
| Klinger | 22 | 25 | 2 | 113.64 | 18.18 | 0.00 |
| McCullum | 33 | 55 | 1 | 166.67 | 27.27 | 9.09 |
| Patterson | 24 | 26 | 0 | 108.33 | 20.83 | 8.33 |
| Peirson | 22 | 28 | 2 | 127.27 | 18.18 | 9.09 |
| Short | 25 | 43 | 3 | 172.00 | 36.00 | 4.00 |
| 3rd over | 430 | 552 | 18 | 128.37 | 18.60 | 15.81 |
| Dunk | 18 | 30 | 0 | 166.67 | 33.33 | 16.67 |
| Finch | 18 | 28 | 0 | 155.56 | 22.22 | 22.22 |
| Heazlett | 16 | 26 | 1 | 162.50 | 25.00 | 12.50 |
| Klinger | 19 | 29 | 0 | 152.63 | 26.32 | 15.79 |
| M Harris | 21 | 40 | 0 | 190.48 | 38.10 | 28.57 |
| McCullum | 18 | 40 | 0 | 222.22 | 38.89 | 44.44 |
| Quiney | 19 | 30 | 0 | 157.89 | 26.32 | 26.32 |
| 4 over | 423 | 619 | 24 | 146.34 | 21.99 | 13.24 |
| D Hughes | 25 | 38 | 0 | 152.00 | 28.00 | 4.00 |
| Dunk | 20 | 40 | 2 | 200.00 | 30.00 | 5.00 |
| Finch | 25 | 51 | 1 | 204.00 | 36.00 | 20.00 |
| McCullum | 22 | 36 | 1 | 163.64 | 22.73 | 9.09 |
| 5th over | 425 | 562 | 19 | 132.24 | 17.88 | 12.71 |
| D Hughes | 25 | 32 | 0 | 128.00 | 16.00 | 8.00 |
| Dunk | 16 | 20 | 0 | 125.00 | 12.50 | 12.50 |
| Finch | 18 | 27 | 1 | 150.00 | 16.67 | 22.22 |
| Klinger | 15 | 19 | 1 | 126.67 | 13.33 | 20.00 |
| M Harris | 19 | 17 | 1 | 89.47 | 10.53 | 10.53 |
| McCullum | 17 | 45 | 0 | 264.71 | 52.94 | 17.65 |
| Ross | 22 | 17 | 0 | 77.27 | 9.09 | 4.55 |
| Wright | 22 | 41 | 1 | 186.36 | 31.82 | 27.27 |
| 6th over | 434 | 615 | 19 | 141.71 | 22.58 | 16.36 |
| Bailey | 18 | 21 | 1 | 116.67 | 11.11 | 11.11 |
| D Hughes | 24 | 30 | 2 | 125.00 | 20.83 | 8.33 |
| Dunk | 28 | 58 | 0 | 207.14 | 35.71 | 39.29 |
| M Harris | 21 | 29 | 1 | 138.10 | 19.05 | 4.76 |
| Wright | 21 | 23 | 0 | 109.52 | 14.29 | 19.05 |
| 7th over | 428 | 452 | 10 | 105.61 | 8.18 | 20.56 |
| Finch | 18 | 15 | 0 | 83.33 | 5.56 | 22.22 |
| 8th over | 429 | 480 | 15 | 111.89 | 9.32 | 20.05 |
| Dunk | 21 | 40 | 0 | 190.48 | 28.57 | 28.57 |
| Finch | 19 | 33 | 0 | 173.68 | 15.79 | 26.32 |
| Henriques | 25 | 30 | 0 | 120.00 | 8.00 | 16.00 |
| Hodge | 20 | 21 | 0 | 105.00 | 10.00 | 15.00 |
| Morgan | 15 | 8 | 0 | 53.33 | 6.67 | 0.00 |
| Wright | 18 | 33 | 0 | 183.33 | 22.22 | 38.89 |
| 9th over | 425 | 477 | 24 | 112.24 | 9.41 | 20.24 |
| Bell | 16 | 18 | 0 | 112.50 | 12.50 | 12.50 |
| Finch | 15 | 30 | 1 | 200.00 | 20.00 | 20.00 |
| Henriques | 25 | 28 | 2 | 112.00 | 8.00 | 24.00 |
| Hodge | 21 | 23 | 0 | 109.52 | 9.52 | 28.57 |
| KP | 18 | 11 | 0 | 61.11 | 0.00 | 11.11 |
| 10th over | 426 | 524 | 13 | 123.00 | 11.97 | 22.30 |
| Bell | 17 | 27 | 1 | 158.82 | 11.76 | 17.65 |
| Henriques | 19 | 32 | 2 | 168.42 | 26.32 | 21.05 |
| KP | 19 | 29 | 0 | 152.63 | 21.05 | 21.05 |
| McCullum | 15 | 22 | 1 | 146.67 | 20.00 | 26.67 |
| Roher | 21 | 38 | 2 | 180.95 | 23.81 | 23.81 |
| White | 20 | 37 | 0 | 185.00 | 25.00 | 20.00 |
| 11th over | 425 | 526 | 18 | 123.76 | 12.24 | 17.41 |
| Finch | 14 | 18 | 0 | 128.57 | 7.14 | 50.00 |
| Hodge | 25 | 43 | 0 | 172.00 | 24.00 | 20.00 |
| Ross | 19 | 14 | 0 | 73.68 | 0.00 | 0.00 |
| White | 20 | 24 | 1 | 120.00 | 15.00 | 10.00 |
| 12th over | 426 | 501 | 26 | 117.61 | 11.97 | 20.89 |
| Burns | 15 | 18 | 0 | 120.00 | 6.67 | 6.67 |
| Hodge | 18 | 16 | 1 | 4.06 | 34.25 | 0.00 |
| M Marsh | 21 | 21 | 0 | 3.52 | 37.84 | 0.00 |
| Ross | 21 | 14 | 1 | 3.57 | 33.33 | 0.00 |
| 13th over | 419 | 572 | 17 | 0.15 | 1282.26 | 222.58 |
| Bailey | 14 | 18 | 1 | 5.93 | 32.53 | 7.23 |
| Burns | 19 | 33 | 0 | 4.21 | 47.50 | 7.50 |
| Hodge | 16 | 24 | 3 | 4.69 | 44.00 | 16.00 |
| KP | 15 | 24 | 0 | 5.93 | 33.71 | 6.74 |
| Lynn | 15 | 30 | 0 | 5.07 | 47.37 | 23.68 |
| M Marsh | 17 | 16 | 1 | 4.65 | 34.18 | 0.00 |
| 14th over | 425 | 544 | 28 | 0.16 | 1116.42 | 205.97 |
| Cooper | 15 | 23 | 1 | 7.07 | 25.47 | 0.00 |
| KP | 19 | 35 | 1 | 4.95 | 47.87 | 6.38 |
| Lynn | 11 | 18 | 0 | 7.45 | 29.27 | 7.32 |
| Ross | 15 | 13 | 2 | 5.73 | 27.91 | 0.00 |
| Wright | 13 | 14 | 0 | 5.69 | 27.03 | 0.00 |
| 15th over | 415 | 589 | 21 | 0.17 | 1104.35 | 226.09 |
| Bailey | 11 | 17 | 1 | 9.00 | 21.21 | 6.06 |
| Hodge | 14 | 16 | 0 | 6.86 | 20.83 | 0.00 |
| KP | 16 | 29 | 0 | 6.06 | 34.02 | 6.19 |
| 16th over | 410 | 541 | 22 | 0.19 | 975.00 | 181.58 |
| Burns | 15 | 16 | 0 | 6.93 | 19.23 | 11.54 |
| Cooper | 10 | 7 | 1 | 12.20 | 10.66 | 0.00 |
| Cummins | 11 | 20 | 0 | 8.45 | 27.96 | 6.45 |
| Cutting | 12 | 25 | 1 | 8.75 | 28.57 | 11.43 |
| Ferguson | 14 | 21 | 0 | 9.14 | 22.66 | 0.00 |
| M Marsh | 12 | 17 | 0 | 8.33 | 22.00 | 0.00 |
| Stoinis | 11 | 13 | 0 | 9.36 | 16.50 | 0.00 |
| Wildermuth | 10 | 16 | 1 | 9.40 | 22.34 | 12.77 |
| 17th over | 404 | 563 | 33 | 0.20 | 929.63 | 170.37 |
| Bailey | 12 | 17 | 0 | 10.17 | 18.03 | 4.92 |
| Burns | 13 | 12 | 0 | 8.69 | 17.70 | 0.00 |
| Cooper | 13 | 12 | 2 | 9.54 | 12.90 | 0.00 |
| Cummins | 19 | 24 | 0 | 5.37 | 31.37 | 11.76 |
| Ferguson | 10 | 15 | 0 | 13.70 | 14.60 | 0.00 |
| Klinger | 10 | 20 | 0 | 11.50 | 19.13 | 5.22 |
| M Marsh | 11 | 17 | 0 | 9.36 | 23.30 | 5.83 |
| Pollard | 13 | 16 | 0 | 8.69 | 19.47 | 0.00 |
| Ross | 11 | 10 | 0 | 9.91 | 16.51 | 0.00 |
| Stoinis | 12 | 31 | 0 | 9.33 | 30.36 | 10.71 |
| 18th over | 384 | 603 | 29 | 0.22 | 902.33 | 209.30 |
| Agar | 10 | 15 | 0 | 10.60 | 16.98 | 0.00 |
| Bailey | 11 | 24 | 0 | 12.09 | 21.05 | 4.51 |
| Botha | 14 | 29 | 0 | 8.43 | 28.81 | 5.08 |
| Burns | 18 | 52 | 0 | 6.83 | 48.78 | 29.27 |
| Cummins | 17 | 24 | 1 | 6.29 | 27.10 | 11.21 |
| Ferguson | 14 | 20 | 1 | 10.29 | 18.75 | 4.17 |
| Hodge | 11 | 20 | 1 | 11.64 | 19.53 | 4.69 |
| Pollard | 11 | 24 | 1 | 11.45 | 23.02 | 9.52 |
| Wildermuth | 10 | 4 | 2 | 11.60 | 6.90 | 0.00 |
| 19th over | 341 | 424 | 39 | 0.26 | 650.00 | 113.33 |
| Agar | 11 | 20 | 0 | 10.82 | 19.33 | 5.04 |
| Botha | 13 | 19 | 2 | 11.08 | 16.67 | 0.00 |
| Burns | 10 | 19 | 0 | 16.60 | 14.46 | 0.00 |
| Cummins | 13 | 11 | 3 | 9.46 | 13.82 | 4.88 |
| Ferguson | 10 | 11 | 1 | 14.80 | 12.84 | 0.00 |
| Hilfenhaus | 16 | 5 | 1 | 7.31 | 7.69 | 0.00 |
| M Marsh | 13 | 26 | 1 | 8.77 | 28.95 | 10.53 |
| 20th over | 315 | 473 | 44 | 0.30 | 637.89 | 176.84 |
| Agar | 16 | 30 | 1 | 7.69 | 28.46 | 9.76 |
| Burns | 12 | 20 | 1 | 14.58 | 14.29 | 6.86 |
| Ferguson | 13 | 37 | 2 | 12.31 | 26.25 | 15.00 |
| Green | 11 | 30 | 0 | 10.64 | 26.50 | 15.38 |
| Hilfenhaus | 11 | 7 | 5 | 12.09 | 11.28 | 0.00 |
| M Marsh | 11 | 18 | 1 | 11.09 | 17.21 | 0.00 |
| Pollard | 10 | 25 | 2 | 14.30 | 19.58 | 12.59 |
| Rose | 12 | 20 | 1 | 11.17 | 20.15 | 4.48 |
| Wright | 12 | 22 | 0 | 10.83 | 18.46 | 9.23
|
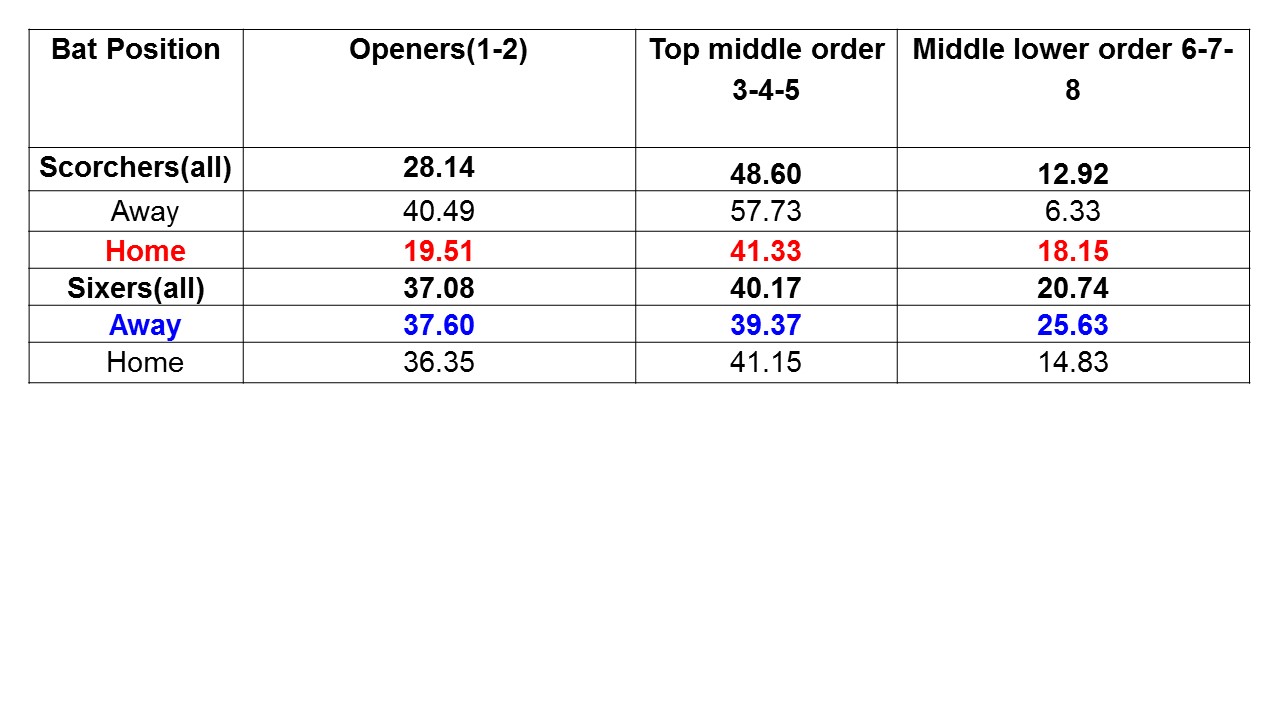
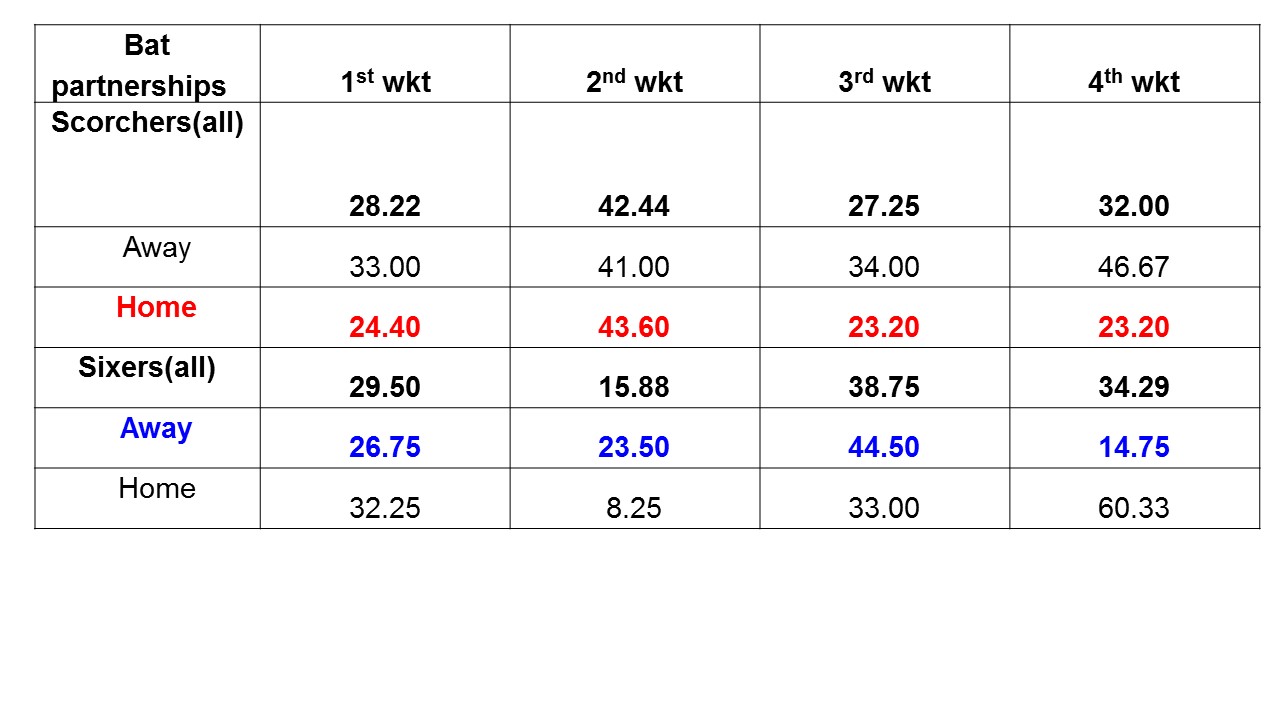
Batting Position and partnerships with average
The data represent % of runs scored in terms of team’s total.Interestingly at home, the Scorchers openers have performed poorly; hence their percentage of contribution to team’s score is least percentage in this tournament! Sixers have balance contribution across batting position.
| Only included the top 5 batting position for this analysis – |
|---|
| Openers 1-2 |
| Top middle order 3-4-5 |
| Middle lower order 5-6-7 |
 |
| Batting Partnerships with average |
 |
Summary:
While it is very difficult to weigh up one indicator against another in terms of its greater or lesser significance to the overall result, qualitatively one might have reached the conclusion before the start of the Final that –
- A batting average for Perth 30+ at home verses Sixers in Perth of 23.7 outweighs the other factors of scoring rates, boundary rates and big overs since they were only marginally different
- Consistent top order batting was Klinger for Scorchers and Hughes for Sixers, and again qualitatively suggesting Klinger outperformed Hughes
- Bringing the innings home Agar for Scorchers and Botha for Sixers were the best for each team during these overs with Botha marginally shading Agar.
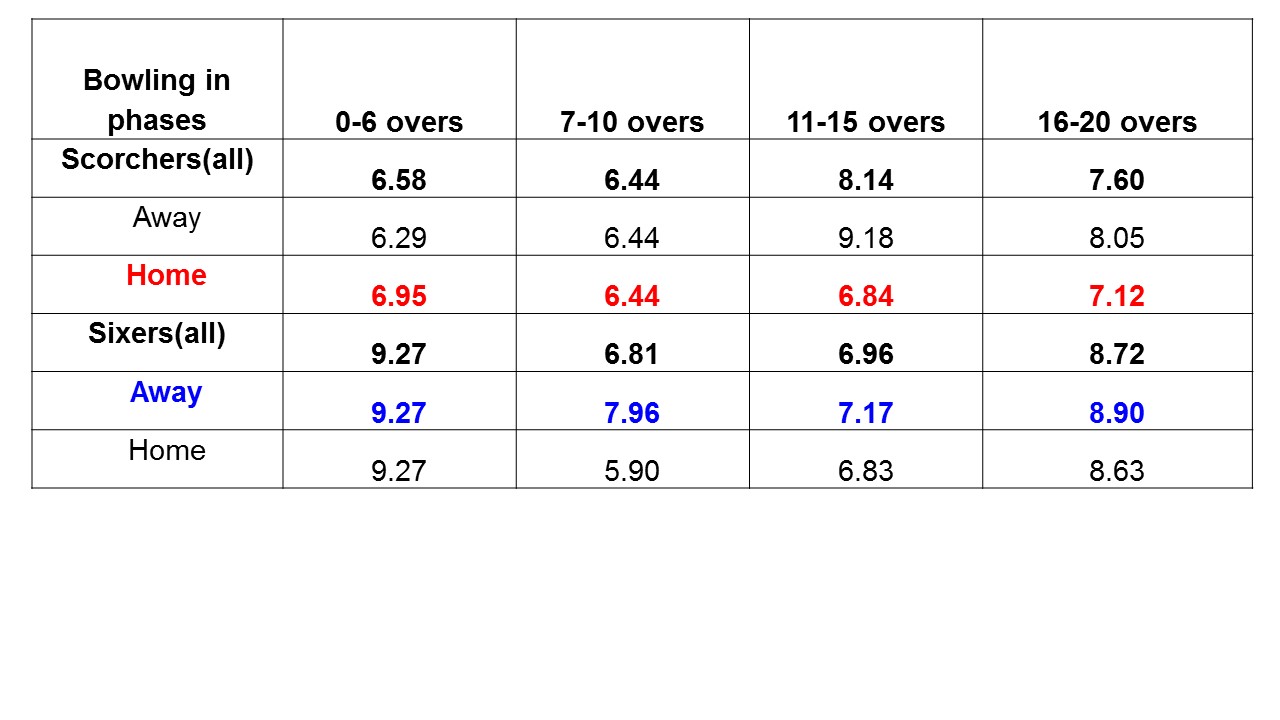
Bowling(Team’s bowling performance home and away with primary indicators)
Drilling into this table from the• Sixers perspective, they start well conceded 6.40 in the first over, but then conceded 10 or more in remaining powerplay overs. On average they concede 12 runs on the 5th over followed by 9.70 in the last over of powerplay. Only once did they concede less than 6 in the fifth over which had excellent effect in the following over
• Scorchers’ bowlers are the meanest in this phase. They start well AND only their 4th over (8.80)and the 6th over(8.00) is most expensive.
| For these indicators – R/OxSR = lower the number the better R/O = lower the number the better Consec <5 R/O = the higher the number the better <5R/O = the higher the number the better >6R/O = lower the number the better |
|---|
 |
 |
Best bowlers for each over of the tournament
Firstly define what best means:
Is it the highest number of balls per scoring shots?
Is it the lowest number of runs in that over?
Is it the highest number of consecutive dot balls?
Is it the highest strike rate ie wickets taken in that over?
Is it the highest number of dot balls in that over?
Is it the lowest number of boundaries in that over?
Is it the lowest number of wides/noballs conceded?
For the purposes of this article, the first three will be the primary indicator to define the best over for a bowler at any time of the game. These indicators tend to apply pressure on batsman to score.
Top best bowlers for each over with three prime indicators (Minimum requirement is 18 balls in every Over)
| Each over’s best | balls. | Runs | wk | R/O | balls/ss | 2 consecutive (%)dot balls |
| 1st over | 445 | 455 | 17 | 6.13 | 2.31 | 12.36 |
| Cooper | 48 | 45 | 3 | 5.63 | 1.85 | 10.42 |
| Green | 19 | 12 | 0 | 3.79 | 3.17 | 5.26 |
| Johnson | 25 | 22 | 3 | 5.28 | 3.57 | 24.00 |
| McKay | 18 | 14 | 3 | 4.67 | 3.60 | 5.56 |
| Neser | 26 | 15 | 1 | 3.46 | 4.33 | 30.77 |
| Steketee | 27 | 17 | 4 | 3.78 | 4.50 | 22.22 |
| 2nd over | 449 | 611 | 15 | 8.16 | 1.86 | 5.12 |
| Richardson | 20 | 23 | 0 | 6.90 | 2.50 | 0.00 |
| Russell | 21 | 25 | 0 | 7.14 | 1.91 | 4.76 |
| Tremain | 18 | 14 | 1 | 4.67 | 2.57 | 22.22 |
| 3th over | 430 | 578 | 18 | 8.07 | 1.81 | 6.51 |
| Beer | 41 | 45 | 2 | 6.59 | 1.52 | 4.88 |
| Christian | 19 | 18 | 1 | 5.68 | 2.38 | 0.00 |
| Johnson | 24 | 12 | 2 | 3.00 | 4.00 | 41.67 |
| 4th over | 423 | 633 | 24 | 8.98 | 1.69 | 6.38 |
| Badree | 18 | 22 | 2 | 7.33 | 1.64 | 0.00 |
| Boland | 30 | 38 | 5 | 7.60 | 1.67 | 0.00 |
| Richardson | 24 | 30 | 4 | 7.50 | 2.18 | 8.33 |
| 5th over | 425 | 573 | 19 | 8.09 | 1.75 | 5.41 |
| Boland | 24 | 14 | 2 | 3.50 | 2.67 | 16.67 |
| Johnson | 24 | 20 | 2 | 5.00 | 2.40 | 12.50 |
| Laughlin | 26 | 18 | 1 | 4.15 | 2.60 | 7.69 |
| 6th over | 434 | 627 | 19 | 8.67 | 1.64 | 4.15 |
| Jordan | 21 | 27 | 2 | 7.71 | 1.91 | 4.76 |
| Narine | 24 | 20 | 1 | 5.00 | 2.18 | 8.33 |
| 7th over | 428 | 469 | 10 | 6.57 | 1.44 | 2.57 |
| Fawad | 19 | 14 | 1 | 4.42 | 1.90 | 5.26 |
| Hogg | 18 | 13 | 1 | 4.33 | 1.50 | 11.11 |
| Swepson | 24 | 21 | 1 | 5.25 | 1.41 | 4.17 |
| 8th over | 429 | 504 | 15 | 7.05 | 1.51 | 2.56 |
| Hogg | 18 | 12 | 0 | 4.00 | 2.00 | 5.56 |
| Zampa | 19 | 18 | 1 | 5.68 | 1.46 | 0.00 |
| 9th over | 425 | 487 | 24 | 6.88 | 1.49 | 2.59 |
| Agar | 18 | 15 | 0 | 5.00 | 1.29 | 0.00 |
| Boyce | 18 | 19 | 1 | 6.33 | 1.80 | 0.00 |
| Fawad | 18 | 20 | 4 | 6.67 | 2.00 | 11.11 |
| Hogg | 31 | 30 | 0 | 5.81 | 1.55 | 3.23 |
| Swepson | 30 | 21 | 4 | 4.20 | 1.67 | 0.00 |
| Zampa | 18 | 16 | 1 | 5.33 | 1.80 | 0.00 |
| 10th over | 426 | 532 | 13 | 7.49 | 1.45 | 3.29 |
| Bresnan | 18 | 20 | 1 | 6.67 | 1.50 | 5.56 |
| Narine | 18 | 18 | 0 | 6.00 | 1.29 | 0.00 |
| O’Connor | 18 | 22 | 0 | 7.33 | 1.64 | 0.00 |
| Zampa | 18 | 15 | 0 | 5.00 | 2.00 | 22.22 |
| 11th over | 425 | 552 | 18 | 7.79 | 1.50 | 1.88 |
| Beer | 24 | 17 | 0 | 4.25 | 1.71 | 0.00 |
| Fawad | 18 | 14 | 3 | 4.67 | 2.00 | 11.11 |
| O’Connor | 25 | 33 | 2 | 7.92 | 1.56 | 0.00 |
| Swepson | 42 | 47 | 3 | 6.71 | 1.45 | 0.00 |
| Zampa | 20 | 22 | 1 | 6.60 | 1.54 | 0.00 |
| 12th over | 426 | 521 | 26 | 7.34 | 1.50 | 3.05 |
| Agar | 24 | 26 | 1 | 6.50 | 1.33 | 0.00 |
| Sodhi | 18 | 19 | 3 | 6.33 | 2.00 | 0.00 |
| Wildermuth | 18 | 19 | 0 | 6.33 | 1.80 | 11.11 |
| Zampa | 18 | 19 | 0 | 6.33 | 1.29 | 0.00 |
| 13th over | 419 | 584 | 17 | 8.36 | 1.36 | 1.67 |
| Botha | 18 | 20 | 0 | 6.67 | 1.20 | 0.00 |
| Fawad | 25 | 26 | 1 | 6.24 | 1.39 | 0.00 |
| Johnson | 19 | 26 | 1 | 8.21 | 1.58 | 10.53 |
| O’Connor | 18 | 24 | 1 | 8.00 | 1.20 | 0.00 |
| Tye | 18 | 22 | 1 | 7.33 | 1.80 | 5.56 |
| 14th over | 425 | 548 | 28 | 7.74 | 1.54 | 4.71 |
| Boland | 25 | 20 | 3 | 4.80 | 1.79 | 0.00 |
| Broad | 19 | 26 | 0 | 8.21 | 1.36 | 0.00 |
| Tremain | 20 | 13 | 1 | 3.90 | 3.33 | 35.00 |
| 15th over | 415 | 600 | 21 | 8.67 | 1.53 | 3.13 |
| Hilfenhaus | 18 | 21 | 1 | 7.00 | 1.38 | 0.00 |
| Hogg | 30 | 45 | 2 | 9.00 | 1.36 | 0.00 |
| 16th over | 410 | 562 | 22 | 8.22 | 1.48 | 3.41 |
| Agar | 19 | 19 | 1 | 6.00 | 1.73 | 15.79 |
| Dwarshuis | 18 | 25 | 1 | 8.33 | 1.50 | 0.00 |
| Narine | 30 | 39 | 4 | 7.80 | 1.43 | 0.00 |
| Watson | 18 | 13 | 2 | 4.33 | 1.80 | 0.00 |
| Wildermuth | 33 | 46 | 1 | 8.36 | 1.32 | 3.03 |
| 17th over | 404 | 583 | 33 | 8.66 | 1.46 | 2.72 |
| Johnson | 19 | 15 | 1 | 4.74 | 2.11 | 10.53 |
| Laughlin | 24 | 16 | 3 | 4.00 | 1.85 | 4.17 |
| Mills | 18 | 23 | 2 | 7.67 | 1.80 | 0.00 |
| Narine | 21 | 24 | 4 | 6.86 | 1.40 | 0.00 |
| Stoinis | 18 | 18 | 1 | 6.00 | 1.06 | 0.00 |
| 18th over | 384 | 626 | 29 | 9.78 | 1.45 | 2.60 |
| Botha | 19 | 28 | 1 | 8.84 | 1.58 | 0.00 |
| Brathwaite C | 21 | 28 | 3 | 8.00 | 1.50 | 0.00 |
| Cutting | 40 | 53 | 2 | 7.95 | 1.54 | 2.50 |
| Dwarshuis | 18 | 28 | 2 | 9.33 | 2.00 | 11.11 |
| Tye | 19 | 24 | 1 | 7.58 | 1.73 | 5.26 |
| 19th over | 341 | 462 | 39 | 8.13 | 1.62 | 5.28 |
| Abbott | 18 | 19 | 2 | 6.33 | 1.80 | 5.56 |
| Cummins | 20 | 31 | 2 | 9.30 | 1.67 | 0.00 |
| Dwarshuis | 26 | 38 | 3 | 8.77 | 1.37 | 0.00 |
| Hilfenhaus | 32 | 35 | 3 | 6.56 | 1.88 | 15.63 |
| Steketee | 41 | 51 | 3 | 7.46 | 1.95 | 14.63 |
| 20th over | 315 | 512 | 44 | 9.75 | 1.57 | 4.76 |
| Abbott | 31 | 54 | 6 | 10.45 | 1.48 | 3.23 |
| Cutting | 52 | 85 | 5 | 9.81 | 1.53 | 5.77 |
- Best bowlers for each over of the tournament when defending 160 or less.
(using three prime indicators)
In 34 games there were 14 instances were teams were asked to defend less than 160 score, and only twice(14.28%) teams managed to defend it. Here is a list of best bowlers for each over in this segment.
| <160defending | Balls . | Sum of r/o(without B&LB) | Wkts | R/O | balls/ss | 2 consecutive (%)dot balls |
| 1st over | 116 | 127 | 3 | 6.57 | 2.19 | 9.48 |
| Beer | 18 | 19 | 0 | 6.33 | 1.38 | 5.56 |
| Cooper | 13 | 9 | 1 | 4.15 | 2.60 | 23.08 |
| Johnson | 13 | 18 | 1 | 8.31 | 2.17 | 7.69 |
| Willey | 13 | 6 | 0 | 2.77 | 3.25 | 23.08 |
| 2th over | 112 | 142 | 3 | 7.61 | 1.96 | 4.46 |
| Hilfenhaus | 21 | 24 | 0 | 6.86 | 3.00 | 4.76 |
| 3th over | 111 | 151 | 7 | 8.16 | 2.02 | 8.11 |
| Boland | 19 | 25 | 2 | 7.89 | 2.71 | 21.05 |
| Johnson | 12 | 10 | 1 | 5.00 | 3.00 | 33.33 |
| Willey | 12 | 19 | 2 | 9.50 | 1.71 | 8.33 |
| 4th over | 108 | 129 | 6 | 7.17 | 1.86 | 6.48 |
| Richardson | 18 | 22 | 3 | 7.33 | 2.57 | 11.11 |
| Tremain | 12 | 13 | 0 | 6.50 | 2.00 | 0.00 |
| 5th over | 109 | 117 | 5 | 6.44 | 2.02 | 9.17 |
| Boland | 18 | 10 | 1 | 3.33 | 2.57 | 22.22 |
| Johnson | 12 | 13 | 0 | 6.50 | 2.00 | 0.00 |
| Laughlin | 12 | 5 | 1 | 2.50 | 4.00 | 16.67 |
| 6th over | 111 | 146 | 7 | 7.89 | 1.85 | 4.50 |
| Jordan | 14 | 20 | 1 | 8.57 | 1.75 | 7.14 |
| Narine | 12 | 6 | 1 | 3.00 | 2.40 | 8.33 |
| Richardson | 18 | 14 | 0 | 4.67 | 1.80 | 0.00 |
| 7th over | 108 | 126 | 2 | 7.00 | 1.35 | 1.85 |
| Beer | 18 | 26 | 0 | 8.67 | 1.06 | 0.00 |
| Tye | 12 | 13 | 0 | 6.50 | 1.71 | 0.00 |
| 8th over | 110 | 105 | 5 | 5.73 | 1.59 | 5.45 |
| Stanlake | 13 | 6 | 1 | 2.77 | 3.25 | 23.08 |
| Zampa | 12 | 14 | 0 | 7.00 | 1.20 | 0.00 |
| 9th over | 111 | 109 | 7 | 5.89 | 1.54 | 0.00 |
| Agar | 12 | 9 | 0 | 4.50 | 1.33 | 0.00 |
| Gulbis | 18 | 23 | 2 | 7.67 | 1.50 | 0.00 |
| 10th over | 107 | 122 | 2 | 6.84 | 1.51 | 5.61 |
| Narine | 12 | 11 | 0 | 5.50 | 1.33 | 0.00 |
| Zampa | 12 | 4 | 0 | 2.00 | 3.00 | 33.33 |
| 11th over | 107 | 145 | 6 | 8.13 | 1.57 | 1.87 |
| Beer | 12 | 6 | 0 | 3.00 | 2.00 | 0.00 |
| Tye | 13 | 19 | 1 | 8.77 | 1.63 | 0.00 |
| 12th over | 105 | 119 | 6 | 6.80 | 1.48 | 0.95 |
| Richardson | 13 | 14 | 1 | 6.46 | 1.86 | 7.69 |
| Zampa | 12 | 8 | 0 | 4.00 | 1.50 | 0.00 |
| 13th over | 104 | 139 | 4 | 8.02 | 1.41 | 0.96 |
| Hogg | 13 | 15 | 0 | 6.92 | 1.18 | 0.00 |
| Pollard | 12 | 18 | 0 | 9.00 | 1.20 | 0.00 |
| Stoinis | 12 | 12 | 0 | 6.00 | 1.50 | 0.00 |
| Tye | 12 | 6 | 1 | 3.00 | 2.40 | 8.33 |
| 14th over | 109 | 118 | 4 | 6.50 | 1.68 | 8.26 |
| Tremain | 12 | 8 | 1 | 4.00 | 4.00 | 41.67 |
| Zampa | 12 | 10 | 0 | 5.00 | 1.50 | 0.00 |
| 15th over | 98 | 135 | 5 | 8.27 | 1.53 | 3.06 |
| Hogg | 12 | 15 | 2 | 7.50 | 1.33 | 0.00 |
| Johnson | 12 | 13 | 0 | 6.50 | 2.00 | 0.00 |
| Richardson | 12 | 17 | 0 | 8.50 | 1.20 | 0.00 |
| 16th over | 99 | 139 | 3 | 8.42 | 1.52 | 4.04 |
| Agar | 12 | 13 | 0 | 6.50 | 1.33 | 0.00 |
| Beer | 12 | 16 | 0 | 8.00 | 2.00 | 0.00 |
| 17th over | 100 | 159 | 5 | 9.54 | 1.30 | 0.00 |
| Stoinis | 12 | 12 | 0 | 6.00 | 1.00 | 0.00 |
| 18th over | 92 | 166 | 3 | 10.83 | 1.42 | 2.17 |
| Narine | 6 | 3 | 1 | 3 | 2 | 16.67 |
| M Marsh | 7 | 4 | 1 | 3.43 | 1.75 | 0 |
| Nesser | 4 | 7 | 0 | 7 | 2.00 | 16.67 |
| 19th over | 45 | 63 | 7 | 8.40 | 1.40 | 0 |
| Boland | 11 | 17 | 1 | 9.27 | 1.38 | |
| Laughlin | 6 | 5 | 2 | 5.00 | 2.00 | |
| Rimmington | 6 | 7 | 1 | 7 | 1.50 | |
| 20th over | 22 | 34 | 4 | 9.27 | 1.38 | |
| Finch | 6 | 12 | 2 | 12 | 1.50 | |
| Richardson | 7 | 12 | 0 | 10.49 | 1.40 |
Best type of bowlers (Spin & Pace) for each phase
This season spinners have picked 9 wickets(56) at At WACA @ 32.89 run/wkt conceding 7.28/over and have conceded less boundary than fast bowlers. An off spinner has been the most economical of any bowler at this venue this year!. Hence Johan Botha’s performance would be key for Sixers| Here is how various type of bowlers performed at WACA. |
|---|
 |
Phase wise performance for all type of bowlers in this tournament
| Balls | Runs | Wkt | R/O | balls/ss | 4/6ss | % < 6 runs | 2 consecutive (%)dot balls | |
| (0-6) | 667 | 812 | 31 | 7.30 | 1.98 | 17.09 | 35.08 | 7.05 |
| LF | 37 | 41 | 2 | 6.65 | 2.31 | 16.22 | 32.43 | 13.51 |
| LMF | 31 | 30 | 2 | 5.81 | 2.38 | 16.13 | 58.06 | 16.13 |
| RFM | 88 | 118 | 3 | 8.05 | 1.76 | 19.32 | 27.27 | 1.14 |
| RM | 6 | 6 | 1 | 6.00 | 2.00 | 16.67 | 0.00 | 0.00 |
| RMF | 304 | 344 | 17 | 6.79 | 2.17 | 15.46 | 45.39 | 8.88 |
| SLA | 61 | 71 | 1 | 6.98 | 1.56 | 11.48 | 19.67 | 3.28 |
| (7-10) | 436 | 462 | 16 | 6.36 | 1.49 | 8.72 | 0.00 | 3.21 |
| LBG | 96 | 93 | 3 | 5.81 | 1.68 | 9.38 | 6.25 | |
| LMF | 7 | 8 | 0 | 6.86 | 1.17 | 0.00 | 0.00 | |
| OFFIE | 54 | 47 | 3 | 5.22 | 1.42 | 3.70 | 1.85 | |
| RF | 18 | 13 | 1 | 4.33 | 2.25 | 5.56 | 16.67 | |
| RM | 37 | 44 | 3 | 7.14 | 1.48 | 13.51 | 0.00 | |
| RMF | 115 | 139 | 4 | 7.25 | 1.55 | 13.91 | 3.48 | |
| SLA | 66 | 71 | 0 | 6.45 | 1.22 | 1.52 | 0.00 | |
| SLC | 31 | 28 | 2 | 5.42 | 1.63 | 6.45 | 0.00 | |
| (11-15) | 523 | 656 | 25 | 7.53 | 1.53 | 14.72 | 32.12 | 3.06 |
| LBG | 78 | 102 | 5 | 7.85 | 1.34 | 11.54 | 53.85 | 0.00 |
| LF | 26 | 26 | 1 | 6.00 | 2.36 | 15.38 | 46.15 | 3.85 |
| OFFIE | 25 | 22 | 1 | 5.28 | 1.56 | 4.00 | 72.00 | 4.00 |
| RFM | 37 | 38 | 3 | 6.16 | 1.61 | 18.92 | 16.22 | 2.70 |
| RMF | 177 | 214 | 8 | 7.25 | 1.70 | 16.38 | 6.78 | |
| SLA | 68 | 90 | 1 | 7.94 | 1.36 | 13.24 | 0.00 | |
| SLC | 39 | 45 | 3 | 6.92 | 1.34 | 5.13 | 0.00 | |
| (16-20) | 358 | 561 | 22 | 9.40 | 1.42 | 17.04 | 1.68 | |
| LF | 6 | 8 | 0 | 8.00 | 1.50 | 16.67 | ||
| LMF | 6 | 6 | 0 | 6.00 | 1.50 | 0.00 | ||
| RM | 20 | 23 | 0 | 6.90 | 1.18 | 5.00 |
Note – (Byes and leg byes not included)
Summary:
As stated for Batting, it is very difficult to weigh up one indicator against another in terms of its greater or lesser significance to the overall result, qualitatively one might have reached the conclusion before the start of the Final that –
- On all indicators with the possible exception of the last 3 overs, the Scorchers’ bowling attack was far more dominant than that of the Sixers
Predictions pre-final:
It was clearly evident from the data presented here, that the Scorchers’ bowling was the key to a Final’s win. There was not sufficient evidence to suggest one team’s batting would or could dominate the opposition
Of course there is another skill component to winning games of cricket – fielding.
While this is somewhat reflected in a team’s bowling performance, a closer analysis will reveal why some teams are more inconsistent than others.
