As the high scoring ODI of the SL v/s ENG series concludes, one wonders if this trend of run fest will continue in one-day cricket, particularly in England. In 3 years, the next World Cup is scheduled to be played in England, and this kind of run fest triggers a thought…will we witness a “500” score in a 50-over match?.
Even with smaller grounds, flat pitches, light powerful bats, and pyro-tech batsmen, predicting this massive score is asking for too much. It seems like an inappropriate and unreasonable theory.
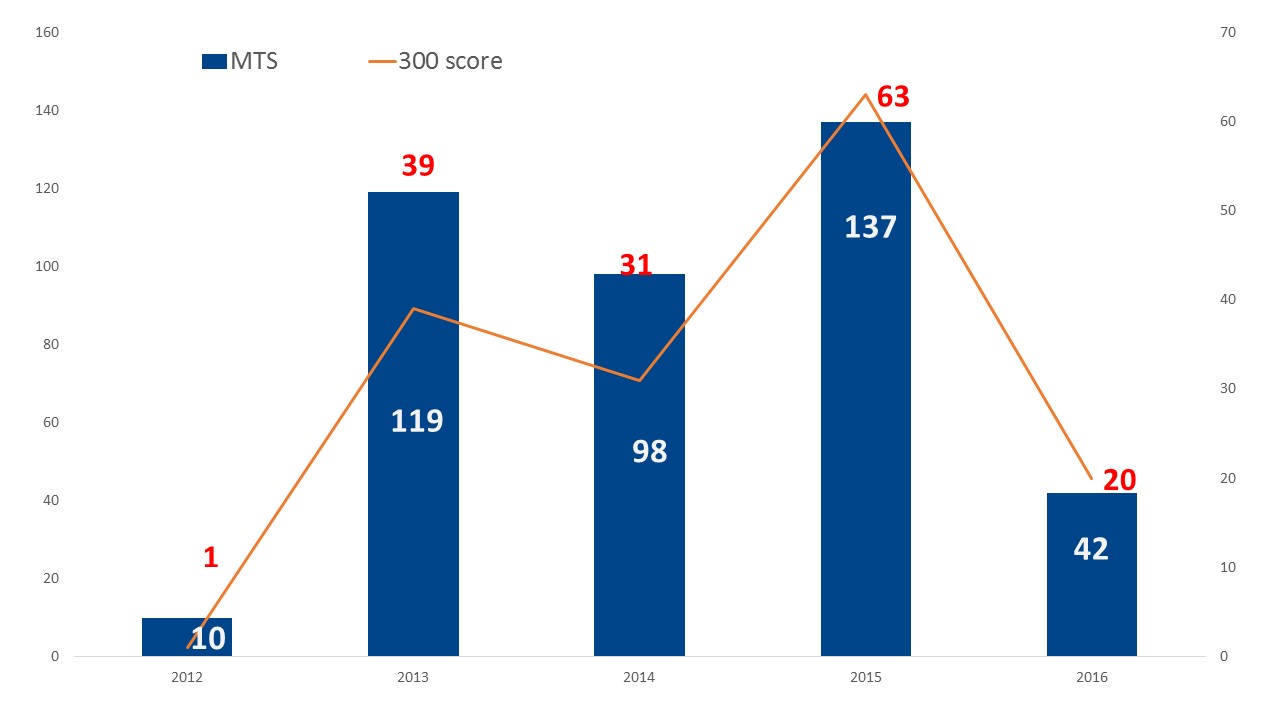
Refer to the chart below for frequency of 300 plus scores since 2013.
Frequency of 300 plus scores since 2013(both inns)
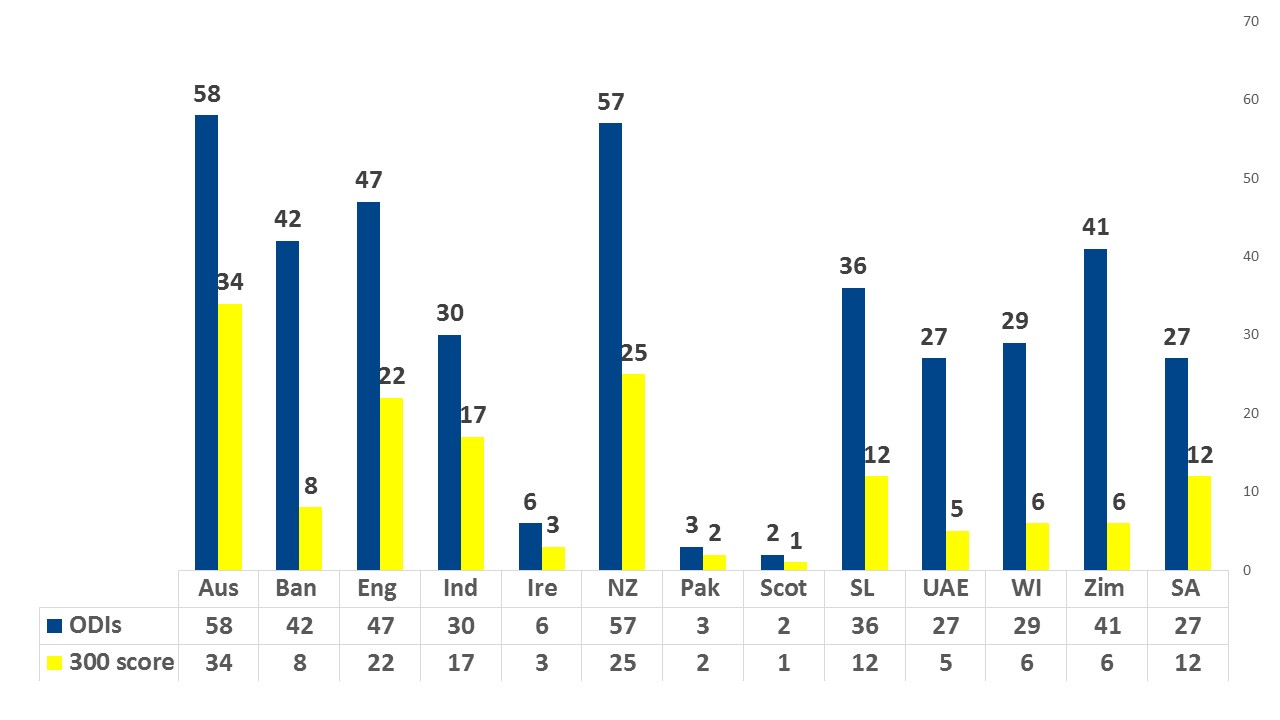
We are in middle of 2016, there is 36 + ODIs to be played this year.| Below table is year wise 300 scores. | Below table features 300 scored in each country. |
 |  |
The ‘scoring shots’(SS) parameter is the best indicator to find its growth.
In the recently concluded series, played in England, SS touched 57.10% – The average SS per innings was 141.50, suggesting that the batsmen are scoring every second ball.
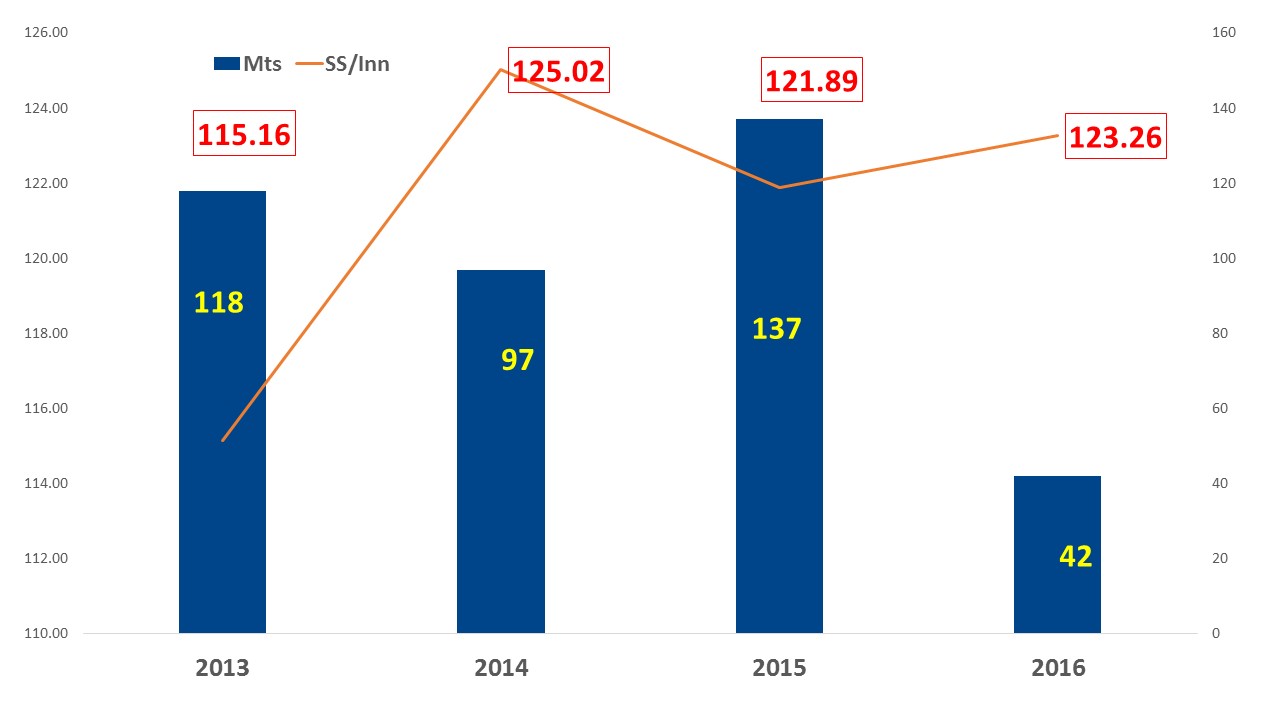
In last few years, there is a constant rise in the number of scoring shots per innings, and England (along with India and Australia) is one of the countries where this rise is rapid.
Scoring shots rising
Below tables shows how scoring shots have progressed since 2013.| Avg Scoring shots in every Int. playing nation. Countries like SA, Aus, Eng and Ind have the highest amount of scoring shots. | |
 | |
| Year wise progress of scoring shots per inn. | |
 | |
To support my point, I found hard evidence supporting this theory of big scores. The last two English county seasons (50-over format) have been a run fest. Last year, the run-rate in Royal London One-day Cup(a 50-over tournament) was 5.60, and this year, after 34 games (midway in the tournament) it is 6.01. Interestingly, in this season, Nottinghamshire notched-up a couple of 400 plus scores, and then almost lost defending 445, falling short of 20 runs.
I know that comparing skills of teams – domestic v/s international is not correct. But this comparison gives you enough proof of how teams have performed.
They have been scoring freely all round England, throughout the season, an indication of what happens when a top team bats well against an associate team in one of the World Cup preliminary rounds.
Royal London One-day Cup (2015 & 2016)
In English domestic cricket there is a rise of scoring shots. Below tables shows how scoring shots have progressed. Featuring each team's performance in 2 years. Along with this i have included performances in venues where minimum 5 games were played per year.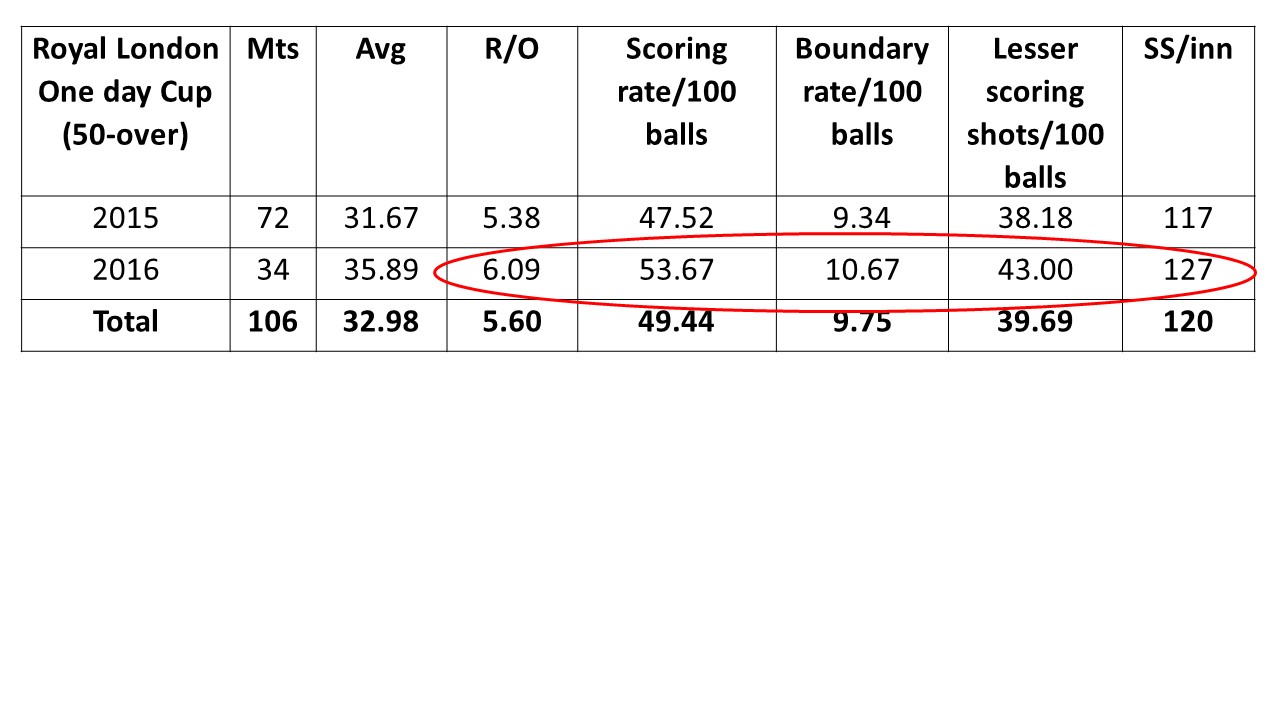 |
| Teams performance : Gloucestershire won the 2015 Royal London Cup. This year they won only 1 in 4 games. Essex and Derbyshire are top of the table. This year Hampshire (161) have the maximum SS/match, last year it was Surrey(164). Below team comparison clearly reflects how SS have grown producing more boundaries and increasing team's run-rate. |
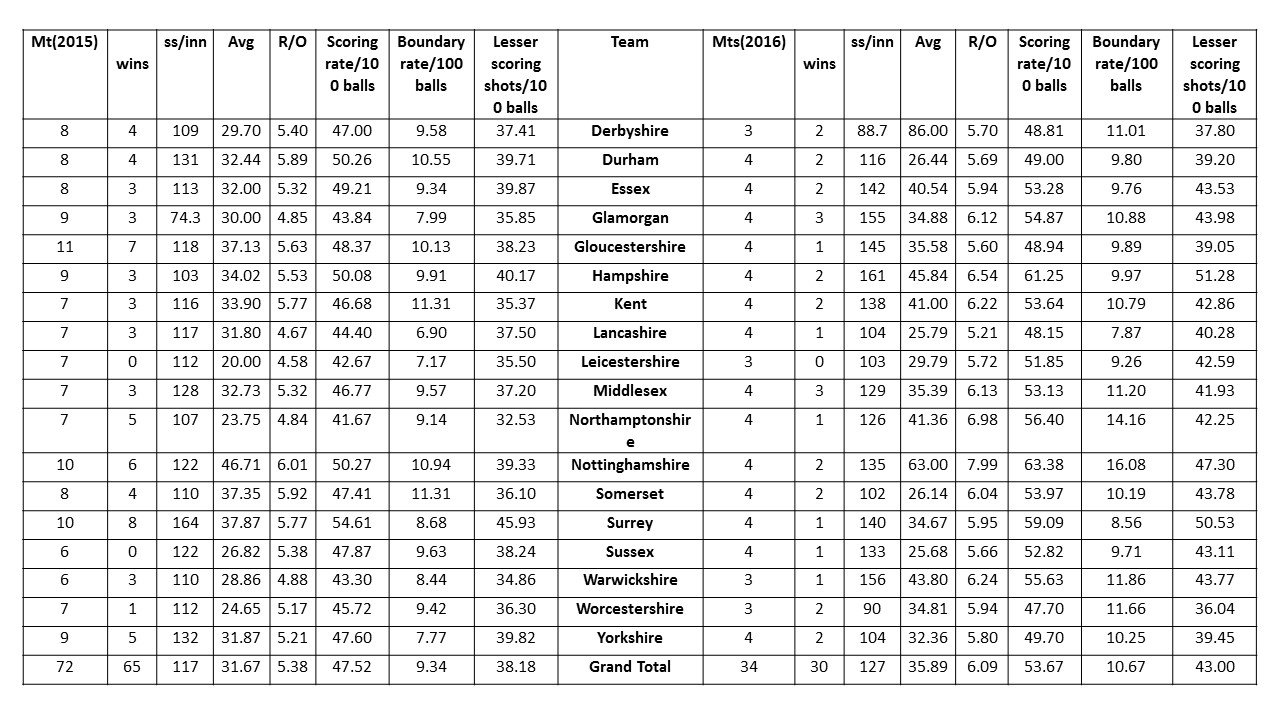 |
| Venue wise performance : Below table shows performance in every ground where Royal London Cup matches are played since 2015. Trent Bridge is a place where thrice 400 were scored. Twice in those inns the Scoring shots(SS) was 200 and more!. |
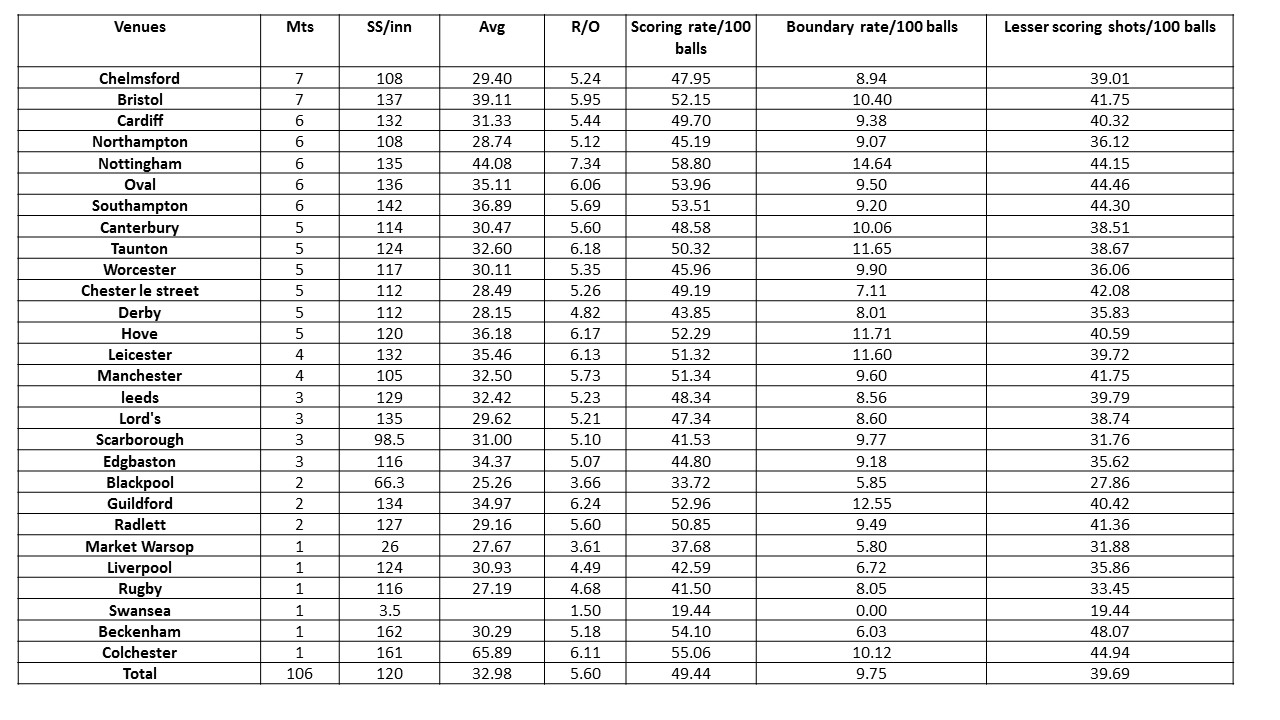 |
All the above, gives us enough evidence that in near future it is possible for teams to score 500+ in a 50-over match. If weather doesn’t play truant in this World Cup held in England, than we might see this mammoth of a score.
To conclude this post, the frequency of 400 plus scores, since 2013, has been 1 out of 58 ODIs. Every year, 100+ ODIs are played. And if 300+ score continues to be a regular feature, than the frequency of 400+ scores will also increase. If the associate teams participate regularly in the FTP (Future Tours Programme), then the window to 500+ scores will also open.
All data updated at end of ENG SL one-day series and 34 Royal London Cup domestic matches, which will resume on 24th of July and end on Sept 17, 2016.
Here is a link to all indicators.

