As the BBL 6 is on the last stage of the tournament. We look at team’s performance.
Toss factor. Success is 35.71%
Interestingly this season the toss has been totally irrelevant. The success of teams winning the toss and winning the match has been low. Only 35.71% success for teams(either batting first or second). Thus far no team has won batting first when winning the toss!.Here is a list of teams with their current position at the table.
 |
|---|
Setting and chasing success :
Teams that batted first have won 35.71% of their games, and all of them were put into bat.The average score for team batting first is 167 runs, suggesting this year has been a high scoring tournament.
Hence if the we have to look at 170 plus score {(round figure to (167+3)}, than the frequency is remarkably high.
And so far 14 times(28 games) teams that first manage to score 170 plus, every second game!.
…..yet it does not guarantee success. The success of winning a game after scoring 170 is 57.14%
| Below table is a snap shot of 1st/2nd batting success. Not surprisingly two teams still have to win while batting first, and one team while still has to win while chasing a target. |
|---|
 |
| Below is a progression chart comparison of teams scores |
| Successful venues. While batting first Adelaide Oval has been the most productive venue(3) and while chasing targets, SCG has been the most productive venue (4). |
 |
Venue wise performance
At MCG (size 172x148)minimum wkts fell behind square{(point to 3rd-man)(long-leg to sqleg)}6.89% (keeper excluded) No other venues had less dismissals in this zone.| Here is a list of grounds with their size (length and width)that has hosted BBL this year. |
|---|
 |
| List of numbers of dismissals(major type) in each venue. |
 |
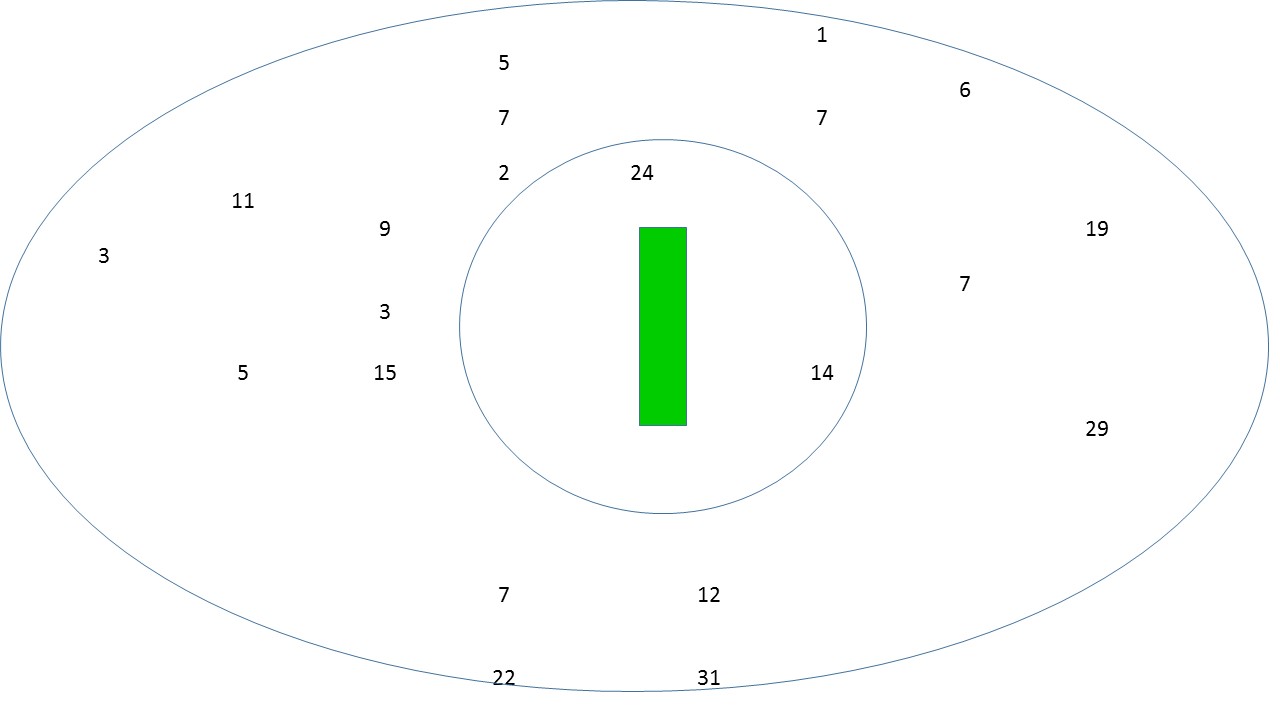
| Field-zone dismissals(bowled and LBW excluded). List includes wickets that fell in all grounds this year. At MCG (size 172x148)minimum wkts fell behind square{(point to 3rd-man)(long-leg to sqleg)}6.89% (keeper excluded) No other venues had less dismissals in this zone. |
 |

