Bowling changes – in a 20-over innings- after the mandatory first and second over, there can be 18 maximum bowling changes. Minimum 3 bowlers required to bowl in that inning.
e.g the first over is bowled by A-bowler followed by B-bowler in second over, now C-bowler takes over in the third over(replacing A). Below table explains the process.
| OVER # | Bowler |
| 1 | A |
| 2 | B |
| 3 | C |
| 4 | A |
| 5 | B |
| 6 | C |
| 7 | A |
| 8 | B |
| 9 | C |
| 10 | A |
| 11 | B |
| 12 | C |
| 13 | A |
| 14 | B |
| 15 | C |
| 16 | A |
| 17 | B |
| 18 | C |
| 19 | A |
| 20 | B |
In this IPL8 – there have been 1355 bowling changes – which is (67.95%) per match. So far it has been a very successful indicator for all teams that took part in this IPL….Either their run-rate went down(<=6 runs/over) from previous over, or lost wickets in that over!
1st bowling – Bowling Changes:715 overs. Wickets: 214 (34.68%)
2nd bowling -Bowling Changes:620 overs. Wickets :191 (31.00%)
RCB (70.00%) & RR(69.60%) lost maximum wickets when bowling was changed when they batted. However they also benefited when they bowled. They were able to pick 81.20(RCB) and (76.70%) RR when they changed their bowlers.
Here is a list of all four teams that qualified for IPL8 playoff.
The indicators are:
– total overs
– No. of bowling changes
-Wickets fell in the bowling change over –
-6 or less runs scored in the bowling change over
| CSK | Bat | Bowl |
| Total Overs | 273.3 | 273.1 |
| Bowling changes | 182 | 145 |
| Wickets fell | 54(68.40%) | 37(39.36%) |
| Run rate <=6 | 84(30.73%) | 74(27.06%) |
| MI | Bat | Bowl |
| Total Overs | 258.5 | 254.2 |
| Bowling changes | 187 | 168 |
| Wickets fell | 47(63.50%) | 47(70.10%) |
| Run rate <=6 | 75(29.01%) | 55(21.63%) |
| RCB | Bat | Bowl |
| Total Overs | 210.3 | 220.2 |
| Bowling changes | 140 | 161 |
| Wickets fell | 47(70.10%) | 66(76.70%) |
| Run rate <= 6 | 50(23.77%) | 70(31.78%) |
| RR | Bat | Bowl |
| Total Overs | 237.3 | 256.1 |
| Bowling changes | 142 | 208 |
| Wickets fell | 48(69.60%) | 56(81.20%) |
| Run rate <= 6 | 55(23.17%) | 87(33.97%) |
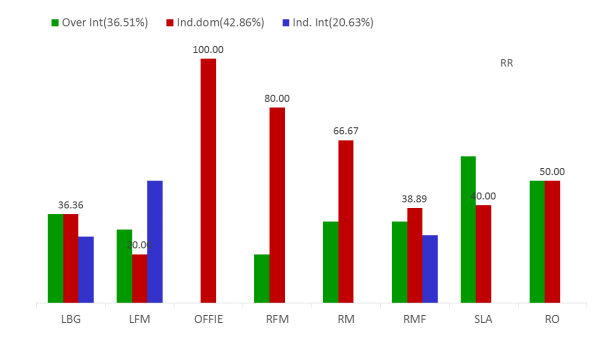
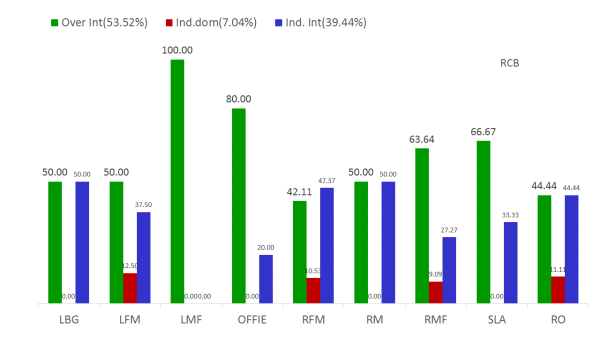
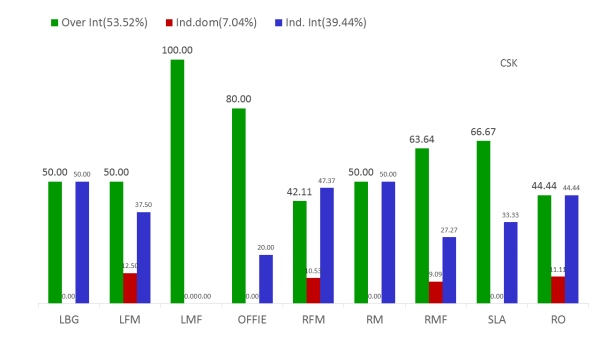
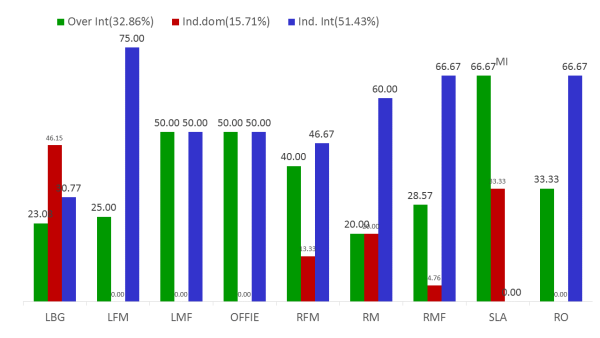
International players have picked 202 wickets(32.70%) when they were brought into bowl. Against 18.60% by Indian International and 14.30% when Domestic bowlers was brought into bowl.
Here is a statistical analysis of these four teams
| Chennai Super Kings | Bat | Bowl | Gap Factor |
| Mts/Won | 14/9 | 14/9 | |
| Runs | 2262 | 2073 | 189 |
| Overs | 273.3 | 273.1 | 0.2 |
| Wickets | 79 | 94 | 15 |
| Avg | 28.60 | 22.05 | 6.58 |
| r/o | 8.30 | 7.59 | 0.70 |
| b/w | 20.70 | 17.48 | 3.27 |
| Scoring rate | 58.90 | 61.11 | -2.17 |
| Boundary rate | 17.90 | 14.79 | 3.09 |
| Mdn | 1.82 | 1.09 | 0.74 |
| % C 5 | 9.49 | 14.13 | 4.64 |
| % L 5 | 31.75 | 38.77 | 7.02 |
| % 6+ | 68.25 | 61.23 | 7.02 |
| %10+ | 32.85 | 25.72 | 7.12 |
| Mumbai Indians | Bat | Bowl | Gap Factor |
| Mts/Won | 14/8 | ||
| Runs | 2231 | 2258 | -27 |
| Overs | 258.5 | 254.2 | 4.3 |
| Wickets | 74 | 67 | -7 |
| Avg | 30.10 | 33.70 | -3.55 |
| r/o | 8.60 | 8.90 | -0.27 |
| b/w | 21.0 | 22.78 | -1.79 |
| Scoring rate | 61.00 | 64.94 | -3.90 |
| Boundary rate | 19.00 | 19.20 | -0.21 |
| Mdn | 2.19 | 1.81 | 0.38 |
| % C 5 | 10.95 | 8.70 | -2.25 |
| % L 5 | 31.02 | 30.07 | -0.95 |
| % 6+ | 68.98 | 69.93 | -0.95 |
| %10+ | 35.04 | 37.32 | -2.28 |
| Royal Challengers Bangalore | Bat | Bowl | Gap Factor |
| Mts/Won | 14/7 | ||
| Runs | 1992 | 1935 | 57 |
| Overs | 210.3 | 220.2 | -9.9 |
| Wickets | 67 | 86 | 19 |
| Avg | 29.70 | 22.50 | 7.23 |
| r/o | 9.50 | 8.48 | 0.99 |
| b/w | 18.90 | 15.37 | 3.54 |
| Scoring rate | 63.60 | 63.54 | 0.05 |
| Boundary rate | 21.50 | 19.06 | 2.40 |
| Mdn | 1.86 | 0.83 | 1.03 |
| % C 5 | 7.91 | 10.74 | 2.84 |
| % L 5 | 26.51 | 29.34 | 2.83 |
| % 6+ | 73.49 | 62.40 | 11.09 |
| %10+ | 44.19 | 34.30 | 9.89 |
| Rajasthan Royals | Bat | Bowl | Gap Factor |
| Mts/Won | 14/7 | ||
| Runs | 2028 | 2202 | -174 |
| Overs | 237.3 | 256.1 | -18.8 |
| Wickets | 69 | 69 | 0 |
| Avg | 29.40 | 31.90 | -2.52 |
| r/o | 8.50 | 8.60 | -0.05 |
| b/w | 20.70 | 22.28 | -1.62 |
| Scoring rate | 66.00 | 60.18 | 5.78 |
| Boundary rate | 16.90 | 18.48 | -1.57 |
| Mdn | 0.39 | 1.56 | -1.17 |
| % C 5 | 6.56 | 11.67 | 5.11 |
| % L 5 | 25.10 | 29.57 | 4.48 |
| % 6+ | 67.18 | 70.43 | -3.25 |
| %10+ | 32.05 | 37.35 | -5.31 |
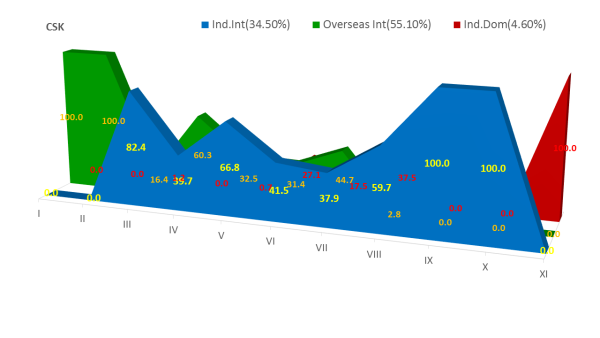
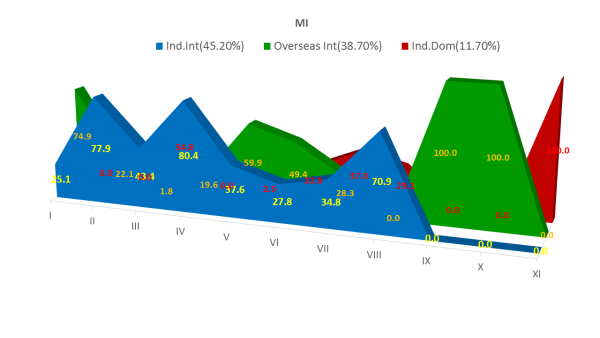
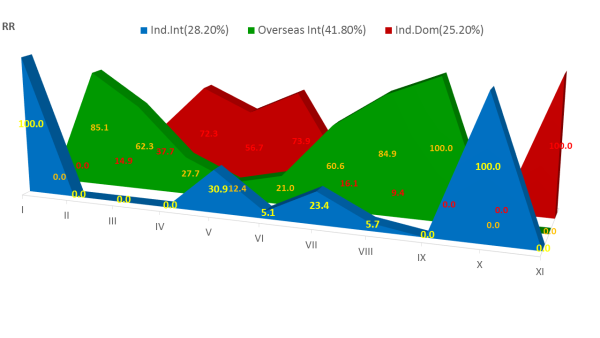
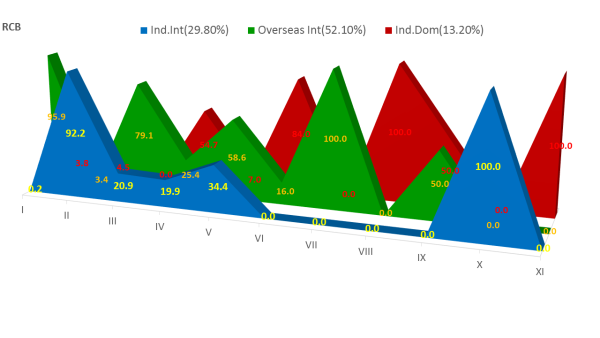
Contribution Category
Batting contribution for Int. Indian, Overseas and Indian Domestic category.
Batting
CSK
MI
RR
RCB
Bowling
RR
RCB
CSK
MI
links to all the stats indicators http://allthatcricket.com/?p=1489

