At end of 20 games – Success rate is 60.00% for teams that batted second.
Nevertheless the average score for first batting has climbed to 171 from 167 in last 5 games – which has made slightly difficult for teams to chase.
TACTICS
The toss factor still remains (mostly)bowl first- like last year – so far 14 times teams elected to field after winning the toss(20 games) and had 8 wins(57.14%) but these wins were based on their ability to restrict teams to a score that can be chased down(successful chase=169,178,185,167,128,156,147) by them…but in last 5 games chasing target has been tough(210,147,192,118(12),182)for teams!.
Last year 41 times team decided to field first, and had 58.50% success rate. Interestingly KKR won the finals chasing huge score of 200. Here the success rate of chasing >170(win ratio 9/24) was 37.50%…. and unbelievably it is the same this year-37.50% success rate chasing >170 target(win ration 3/8 –excluding tied game)
BOWLING
-Worst and Best Bowling side: Surprisingly teams that have bowled poorly or bowled exceptionally well in past, have reversed their fortune in this IPL .
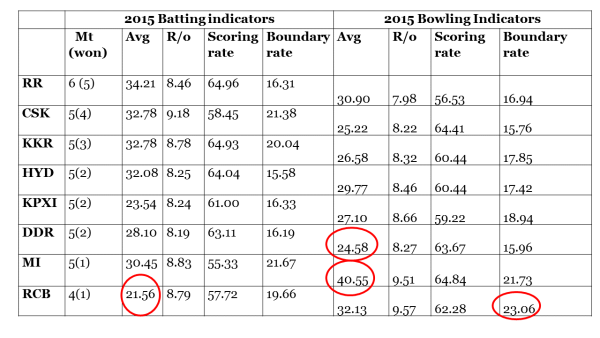
Here is statistical analysis at end of 20 games.
The circle mark in the GFX below is to reflect how poorly teams have performed considering it has been their strength!.
–Surprisingly Mumbai Indians have the worst bowling average (40.55) and have conceded 9.51 runs/over(last year had best run-rate@ 8.06) and behind Royal Challengers Bangalore they have conceded maximum boundaries.
– Shockingly Delhi have the best bowling performance so far(last year had worst run rate)…. A bowling average of 24.58 is considered to be top performance(last year @37.02 was the worst), and have least run rate (8.27 R/O)…Spin in!!.
– Royal Challengers Bangalore have the worst batting average (21.56)….. major reason being they are losing wicket every 15 balls (20.34 is tournament average)
links to all the stats indicators http://allthatcricket.com/?p=1489


