Here is how South Africa bowled against Australia in tri series played in Zimabwe .
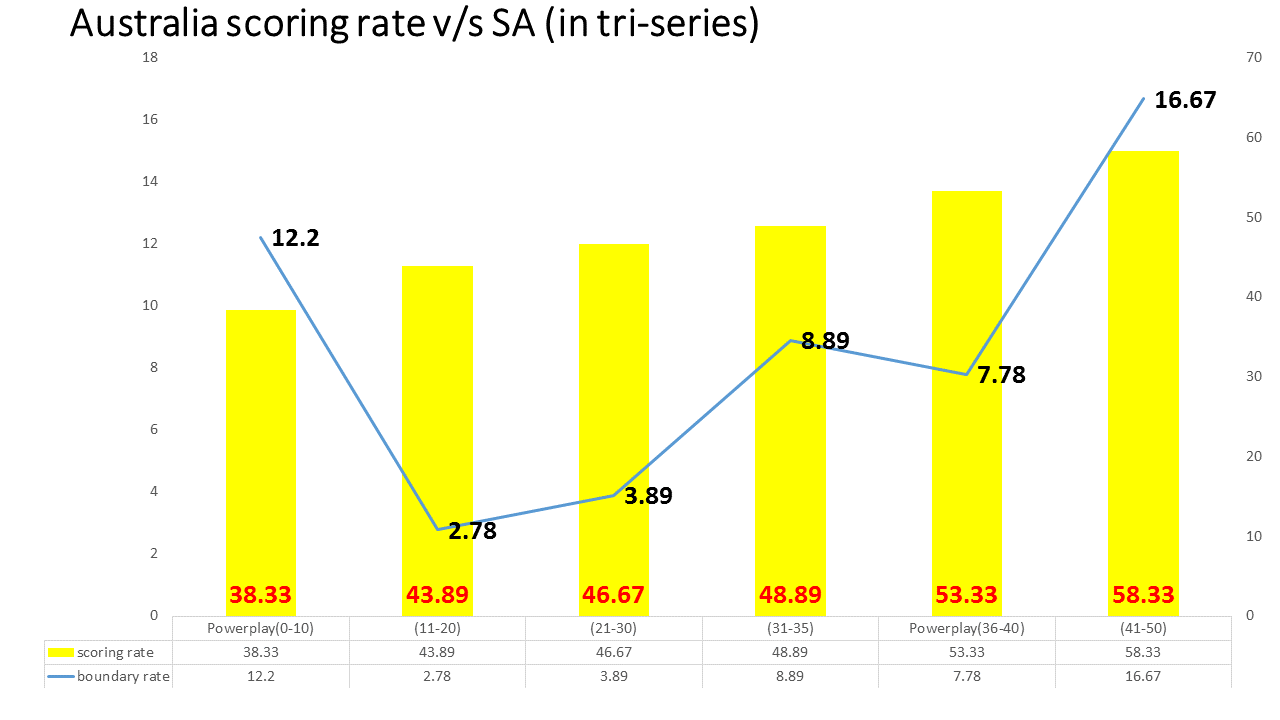
In the tri series maximum boundaries came in last phase
Power play (0-10) performance
In the tri-series the Power play has not been very fruitful for South Africans. On the onset opening batsman go on rampage. Hence including Phillander to open the bowling in Australia was a good choice. In the tri series they had average performance.
| Powerplay(0-10) | Overs | Runs | Wkt | r/o | ss/balls | % L 4 | %10+ | Boundary rate |
| Steyn | 10 | 47 | 1 | 4.70 | 36.67 | 60.00 | 10.00 | 10.00 |
| Parnell | 6 | 36 | 1 | 6.00 | 38.89 | 33.33 | 16.67 | 16.67 |
| M Morkel | 7 | 40 | 0 | 5.71 | 40.48 | 42.86 | 28.57 | 14.29 |
| McLaren | 2 | 10 | 0 | 5.00 | 50.00 | 50.00 | 0.00 | 8.33 |
| Phangiso | 2 | 7 | 0 | 3.50 | 33.33 | 100.00 | 0.00 | 8.33 |
| Total | 30 | 153 | 2 | 5.10 | 38.33 | 53.33 | 13.33 | 12.22 |
This was the best phase for South Africans bowlers, as they started to restrict Australia in this phase.
| (11-20) | Overs | Runs | Wkt | R/O | SS/balls | % L 4 | %10+ | Boundary rate |
| Tahir | 9 | 29 | 2 | 3.22 | 38.89 | 77.78 | 0.00 | 1.85 |
| McLaren | 5 | 20 | 1 | 4.00 | 40.00 | 60.00 | 0.00 | 6.67 |
| Parnell | 2 | 9 | 0 | 4.50 | 25.00 | 50.00 | 0.00 | 0.00 |
| Phangiso | 5 | 16 | 0 | 3.20 | 46.67 | 80.00 | 0.00 | 0.00 |
| M Morkel | 4 | 17 | 0 | 4.25 | 54.17 | 50.00 | 0.00 | 4.17 |
| Steyn | DNB | DNB | DNB | DNB | DNB | DNB | DNB | DNB |
| Total | 30 | 111 | 3 | 3.70 | 43.89 | 63.33 | 0.00 | 2.78 |
And they continued in next phase(21-30) restricting boundaries to minimum ..
| (21-30) | Overs | Runs | Wkt | R/O | SS/balls | % L 4 | %10+ | Boundary rate |
| Steyn | 6 | 17 | 2 | 2.83 | 41.67 | 83.33 | 0.00 | 0.00 |
| Tahir | 10 | 41 | 2 | 4.10 | 46.67 | 70.00 | 0.00 | 5.00 |
| M Morkel | 8 | 45 | 0 | 5.63 | 52.08 | 25.00 | 0.00 | 8.33 |
| Phangiso | 6 | 18 | 0 | 3.00 | 44.44 | 83.33 | 0.00 | 0.00 |
| McLaren | DNB | DNB | DNB | DNB | DNB | DNB | DNB | DNB |
| Parnell | DNB | DNB | DNB | DNB | DNB | DNB | DNB | DNB |
| Total | 30 | 121 | 4 | 4.03 | 46.67 | 63.33 | 0.00 | 3.89 |
This phase(31-35) Australia broke the shackles as they used long handle..
| (31-35) | Overs | Runs | Wkt | R/O | SS/balls | % L 4 | %10+ | Boundary rate |
| Parnell | 4 | 19 | 1 | 4.75 | 45.83 | 75.00 | 25.00 | 8.33 |
| Steyn | 4 | 22 | 1 | 5.50 | 50.00 | 50.00 | 0.00 | 12.50 |
| Phangiso | 1 | 2 | 1 | 2.00 | 33.33 | 100.00 | 0.00 | 0.00 |
| Tahir | 2 | 9 | 0 | 4.50 | 33.33 | 50.00 | 0.00 | 8.33 |
| McLaren | 4 | 23 | 0 | 5.75 | 62.50 | 50.00 | 25.00 | 8.33 |
| M Morkel | DNB | DNB | DNB | DNB | DNB | DNB | DNB | DNB |
| Total | 15 | 75 | 3 | 5.00 | 48.89 | 60.00 | 13.33 | 8.89 |
The second power play has been very fruitful for Aussies as they went at almost 6 runs/over. Although boundary rate was not as high as it was in first Powerplay, but their scoring rate was more than 50.00%!!.
| Powerplay(II) | Overs | Runs | Wkt | R/O | SS/balls | % L 4 | %10+ | Boundary rate |
| Steyn | 2 | 2 | 1 | 1.00 | 8.33 | 100.00 | 0.00 | 0.00 |
| McLaren | 1 | 4 | 1 | 4.00 | 33.33 | 100.00 | 0.00 | 0.00 |
| Parnell | 1 | 6 | 0 | 6.00 | 83.33 | 0.00 | 0.00 | 0.00 |
| M Morkel | 3 | 24 | 1 | 8.00 | 66.67 | 0.00 | 33.33 | 11.11 |
| Tahir | 2 | 6 | 0 | 3.00 | 25.00 | 50.00 | 0.00 | 8.33 |
| Phangiso | 3 | 15 | 0 | 5.00 | 55.56 | 33.33 | 0.00 | 5.56 |
| Total | 15 | 88 | 3 | 5.87 | 53.33 | 33.33 | 20.00 | 7.78 |
The last phase is a real nightmare for South Africans as they conceded almost 9 runs/over.
| (41-50) | Overs | Runs | Wkt | R/O | SS/balls | % L 4 | %10+ | Boundary rate |
| M Morkel | 7 | 47 | 4 | 6.71 | 52.38 | 14.29 | 14.29 | 9.52 |
| Tahir | 6 | 37 | 0 | 6.17 | 55.56 | 16.67 | 0.00 | 8.33 |
| Phangiso | 2 | 12 | 1 | 6.00 | 33.33 | 0.00 | 0.00 | 16.67 |
| Parnell | 4 | 36 | 0 | 9.00 | 62.50 | 25.00 | 50.00 | 16.67 |
| Steyn | 7 | 64 | 1 | 9.14 | 61.90 | 14.29 | 42.86 | 19.05 |
| McLaren | 4 | 57 | 2 | 14.25 | 75.00 | 0.00 | 75.00 | 37.50 |
| Total | 30 | 253 | 8 | 8.43 | 58.33 | 13.33 | 30.00 | 16.67 |
All data is updated at end of 2nd ODI at WACA- (16th Nov, 2014)
Here is a link to meaning of all indicators/formula –
http://allthatcricket.com/?p=1489
