As the tri-series reaches the finals on Sunday June 26th, 2016 at Bridgetown, where host West Indies will play Australia the reigning champion. We look at their performance in the finals of a ODI tournament since its inception.
WestIndies were involved in 45 finals, winning 23(51.11%). Their last final against major team was in 2006, where they lost to Australia in the ICC Champions Trophy in Mumbai. Marlon Samuels is the only current player (in either side) to have played that game. Now coincidentally their last victory in a finals was also in a Champions Trophy…here they beat host England at Oval in 2004.
Australia on the other hand were involved in 89 finals, winning 56(62.92%). Their last success was 2015 World Cup finals (their 5th championship) when they beat NZ at MCG.
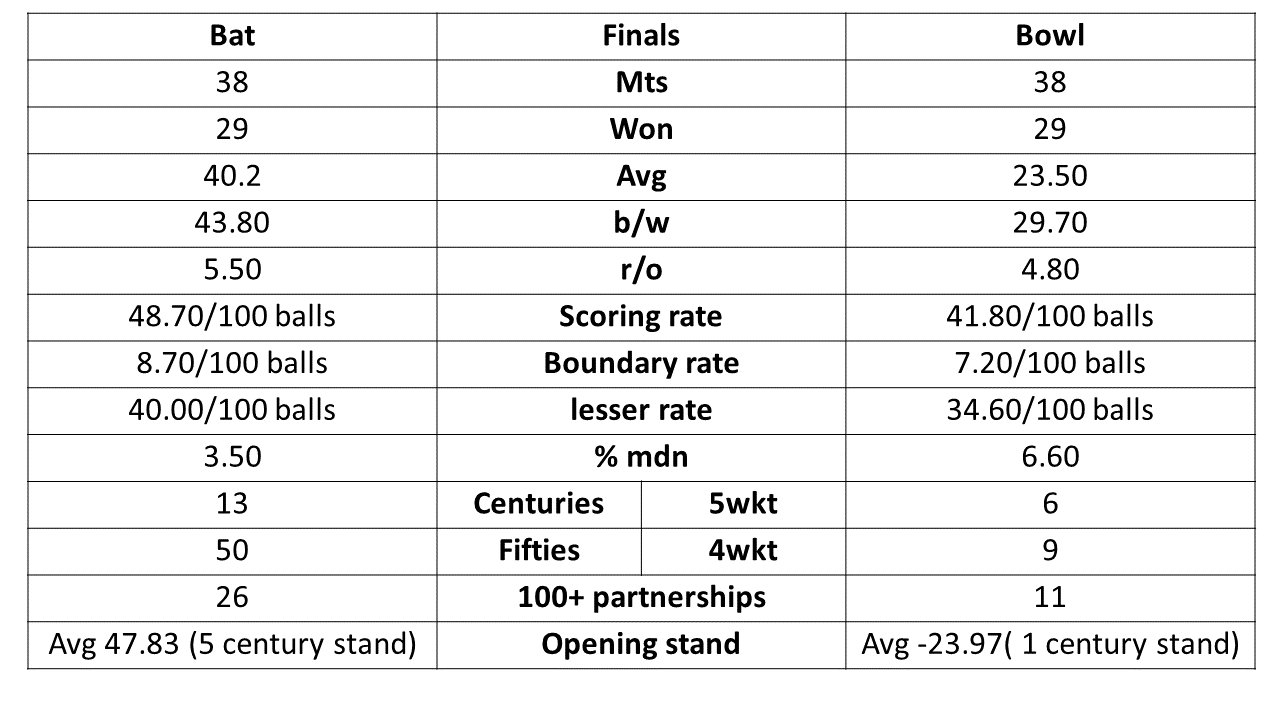
Interestingly since 1998 they were involved in 38 finals winning 29(76.31%), and only few had close result. Their margin of win is huge. While batting first 11 times they won with 50 or more runs, and while chasing 15 times they had 6 or more wkts to spare. Hence there is huge gap between the batting and bowling indicator in below table.
Australia's performance in the finals(since 1998).
Since Oct 1998, Australia were involved in 38 ODI finals( involving 3 or more teams) winning 29(76.31%).-While batting first they won 19 out of 25 games ( 76.00%).
-While bowling first they won 13 out of 10 games (76.92%).
 |
In ongoing series the scenario is different, the host WestIndies(non favorite team before the series)are the most powerful hitting team, compare to other giants (Australia and South Africa) in this tournament.
With 150 boundaries( 4s, 6s), West Indies have scored the most in this series. Compare to them, South Africa finished the tournament with 102(90 x 4s + 12 x 6), and finalist Australia(with one inning short) with 108(90 x 4s + 18 x 6s).
A look at their performance in this series.
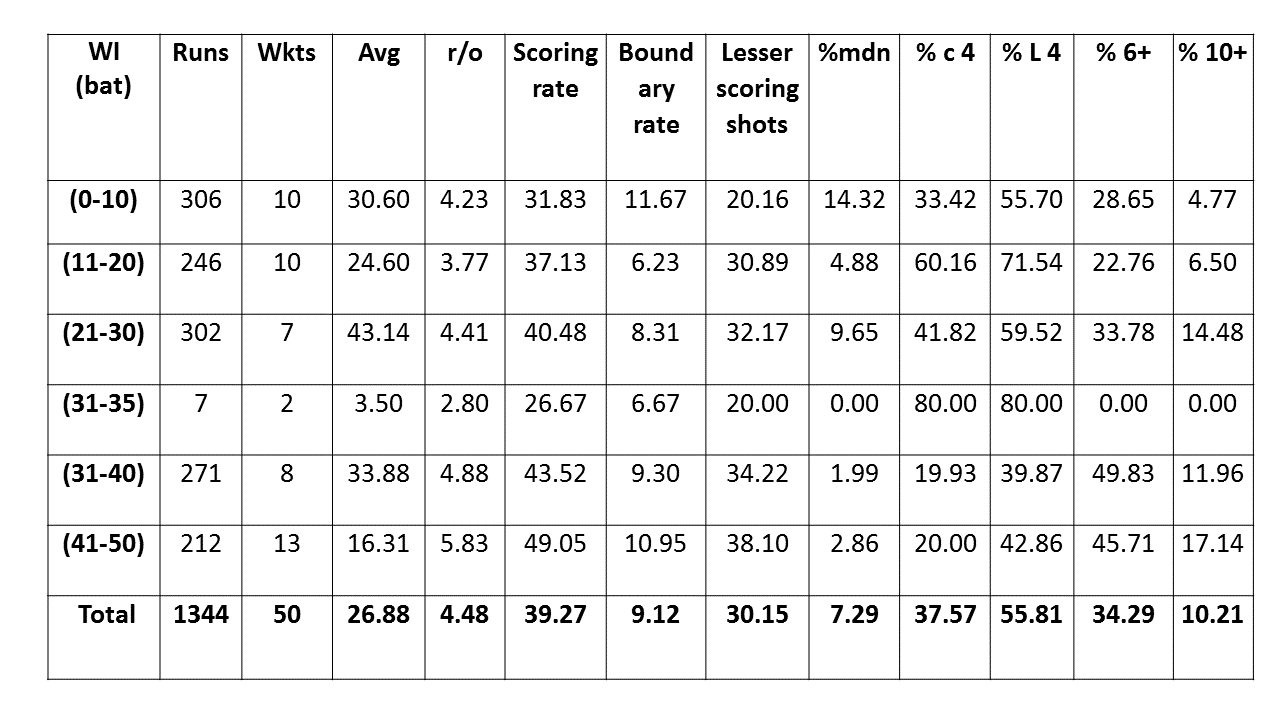
WestIndies.
Surprisingly maximum boundaries(43) came in the first phase(0-10 Overs), usually it is the last 15 overs where their tall powerful batsmen belt the ball out of park. It was not the same in this series. Their middle order(Samuels in particular)held fort and made sure one of them bats through the innings. He was ably supported by opener Johnson Charles, Dwayne Bravo and Dinesh Ramdin(promoted up the order). With a new pair of openers WestIndies are getting a rollicking start to their innings, but not able to sustain long enough which has led to mini-collapse in every game. In first 20 overs they have lost 40 % of total wicketes(20/50), the most for any team in this tournament. Same is the case with their lower order batsman, where their boundary rate is high(compare to their other phase), but overall scoring rate is low. Therefore their overall run-rate has been 5.09.
Australia
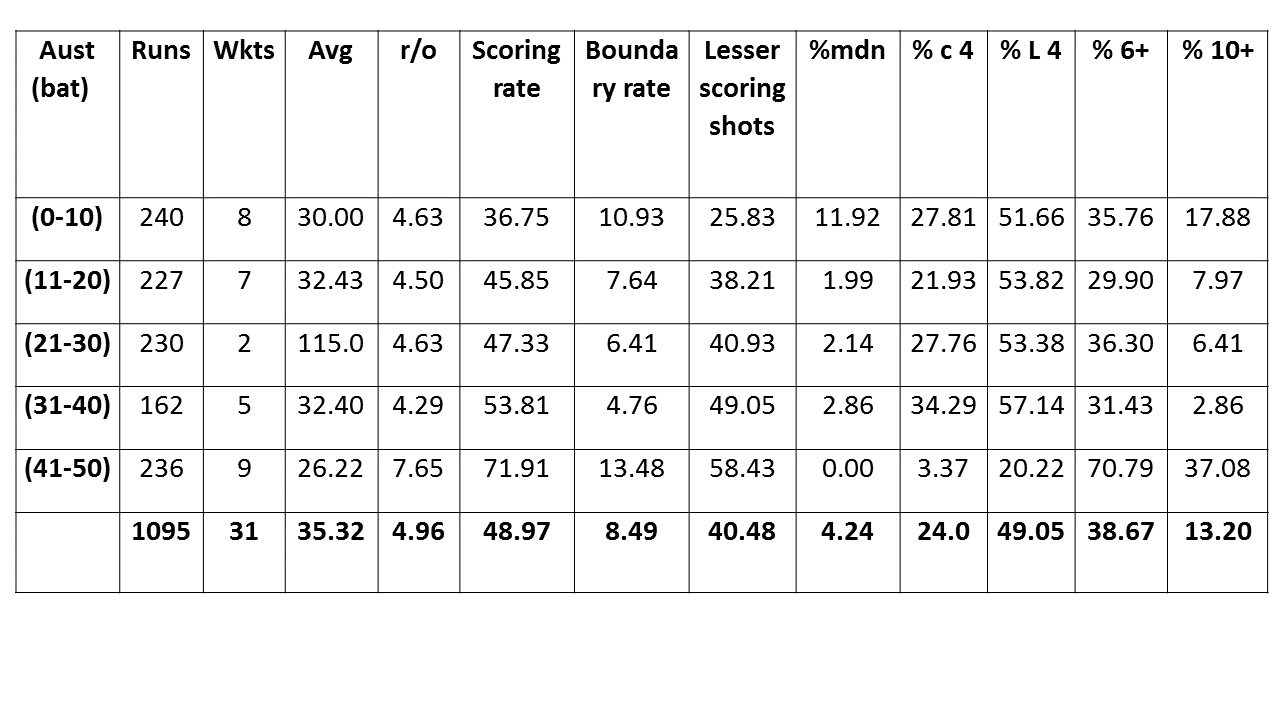
Usually Australia does post one big score in a series, and so far they are unable to post 300 plus score. Their opening stand would be one of the major reason. In 5 inns Avg runs for 1st wkt is 25.80(the lowest amongst 3).. without a single 50 partnership!.
Having said that, their run-rate(5.24) is superior to other two teams in this tournament. Giving the condition and surface, Australia have been cautious building their innings, not losing many wickets upfront yet scoring at a reasonable rate. It is at the end (last 10-overs)they launch themselves scoring at 7.65/over, with boundary rate of 13.48/100 balls.
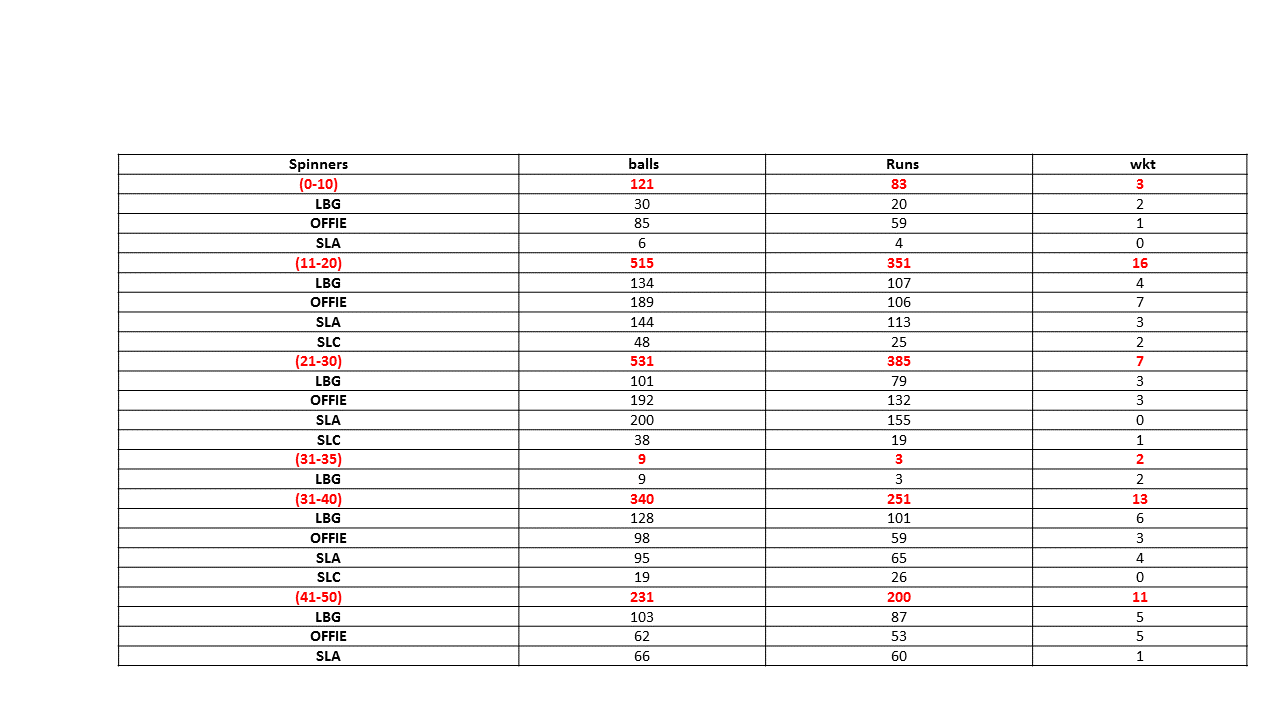
All this suggests that this series was dominated by bowlers and spinners had major contribution.
Interestingly for the first we might have seen all 4 kind of a spinner in action, viz off-spinner, leg-spinner, slow left-arm orthodox and slow left-arm chinaman.
Interestingly for the first time we might have seen all 4 kind of spinners in action, viz off-spinner, leg-spinner, slow left-arm orthodox and slow left-arm chinaman. They were major contributor in picking wickets, so far 41.93% of total wickets were taken by spinners.
Run rate and wickets in each phase for all type of bowlers.
The spinners dented the run-rate between(0-20)overs picking 19 wkts and conceding not more than 4.09/over. The highest run-rate for teams was in last phase(6.27)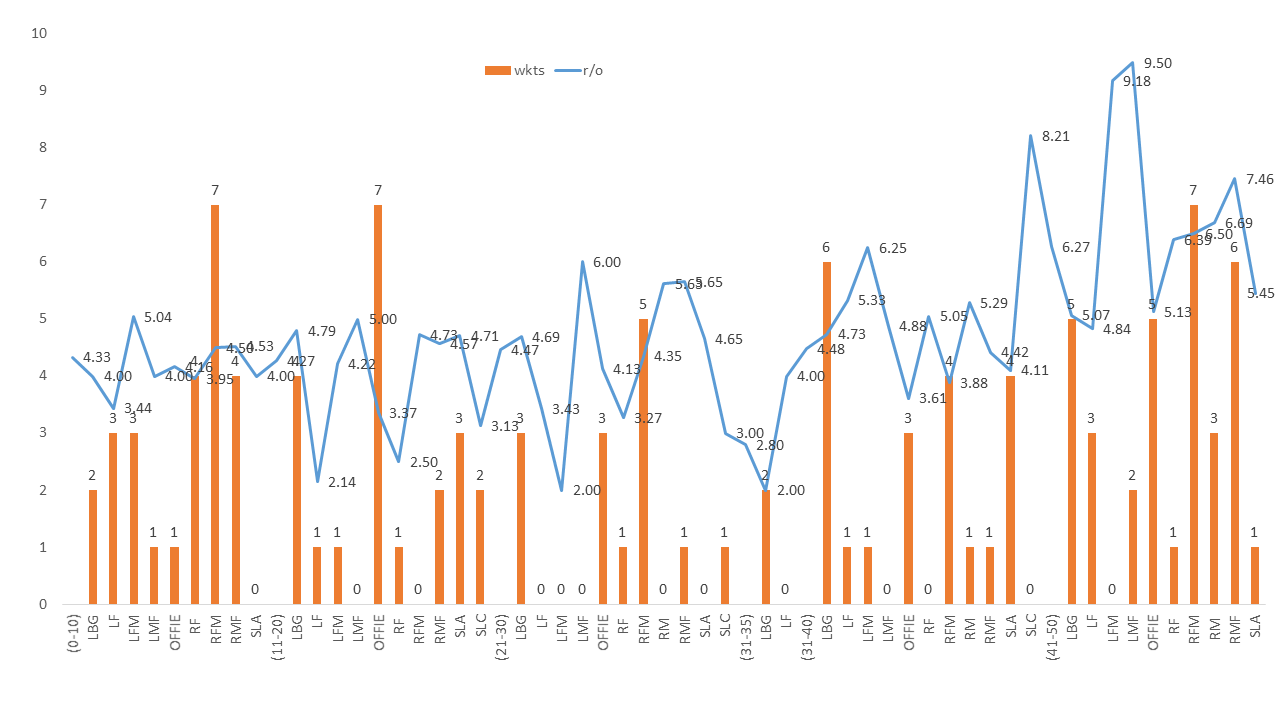 |
| Below table is number of wickets taken by spinners in each phase. |
 |
| Below tables is batting performance in each phase for finalist Australia and WestIndies. The last phase is where Australia are way ahead of host WestIndies. |
 |
 |
All data updated before the finals(June 26,2016).
