Border-Gavaskar test series :End of 2nd Test, India have scored 675 runs in 242.3 overs, and lost 40 wickets. Their run rate is slightly high at 2.78 and strike rate is poor at 36.37(balls per wicket)!. It was much lower in the first 3 innings of the series.
Interestingly since 2011 only thrice India were bundled out for less than 200 in their 1st innings at home!.
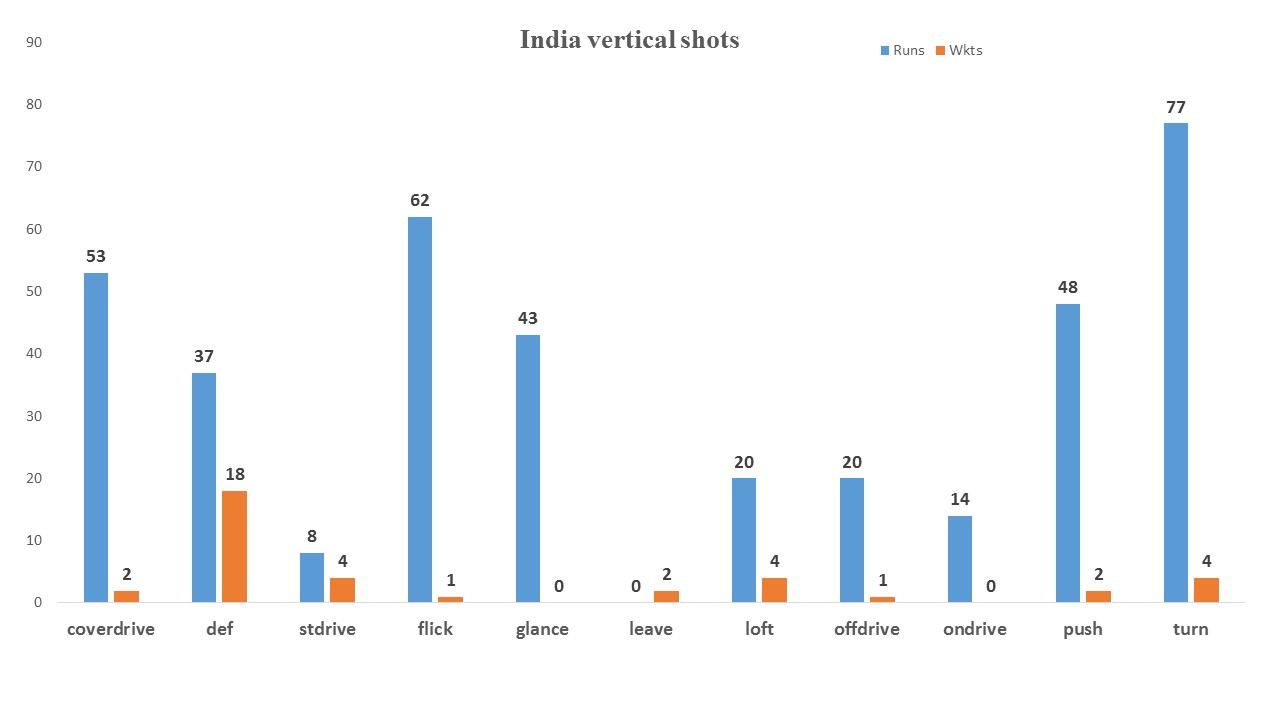
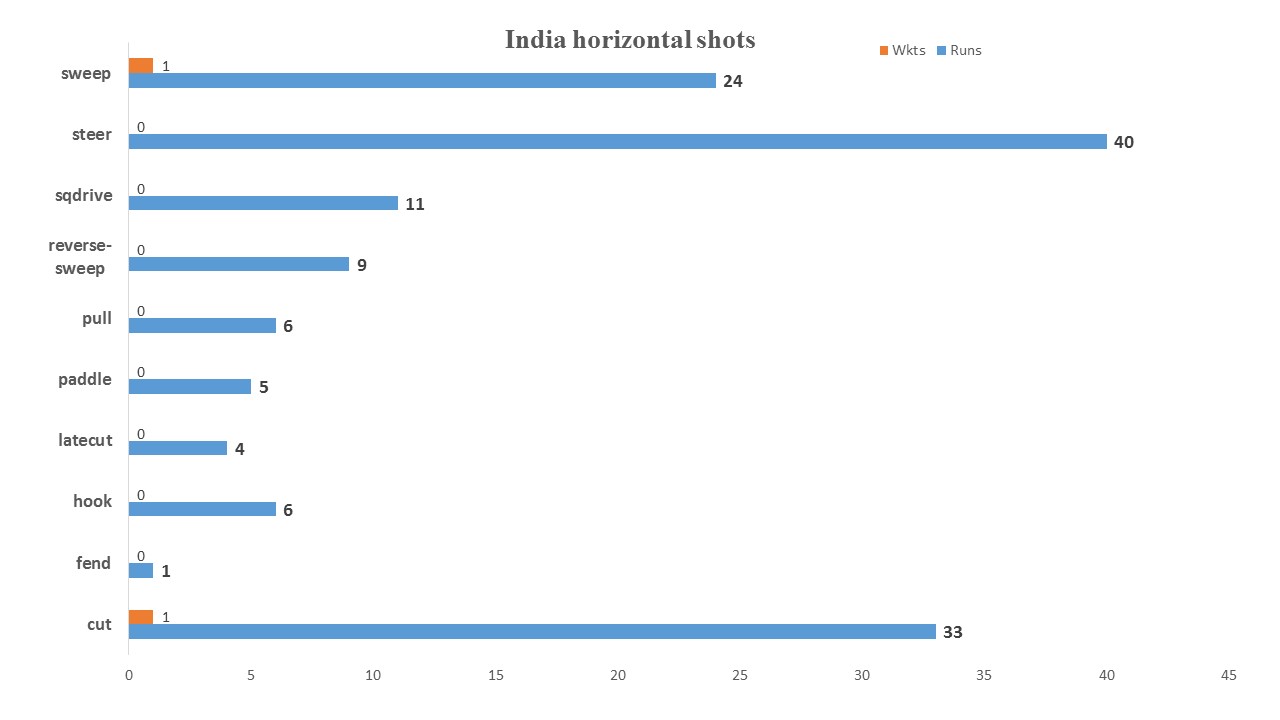
Unlike Australia, India lost only two wickets playing the horizontal shots…but 16 were lost playing the defensive shot!.
Below is India’s analysis of horizontal and vertical shots played in these 2 games.
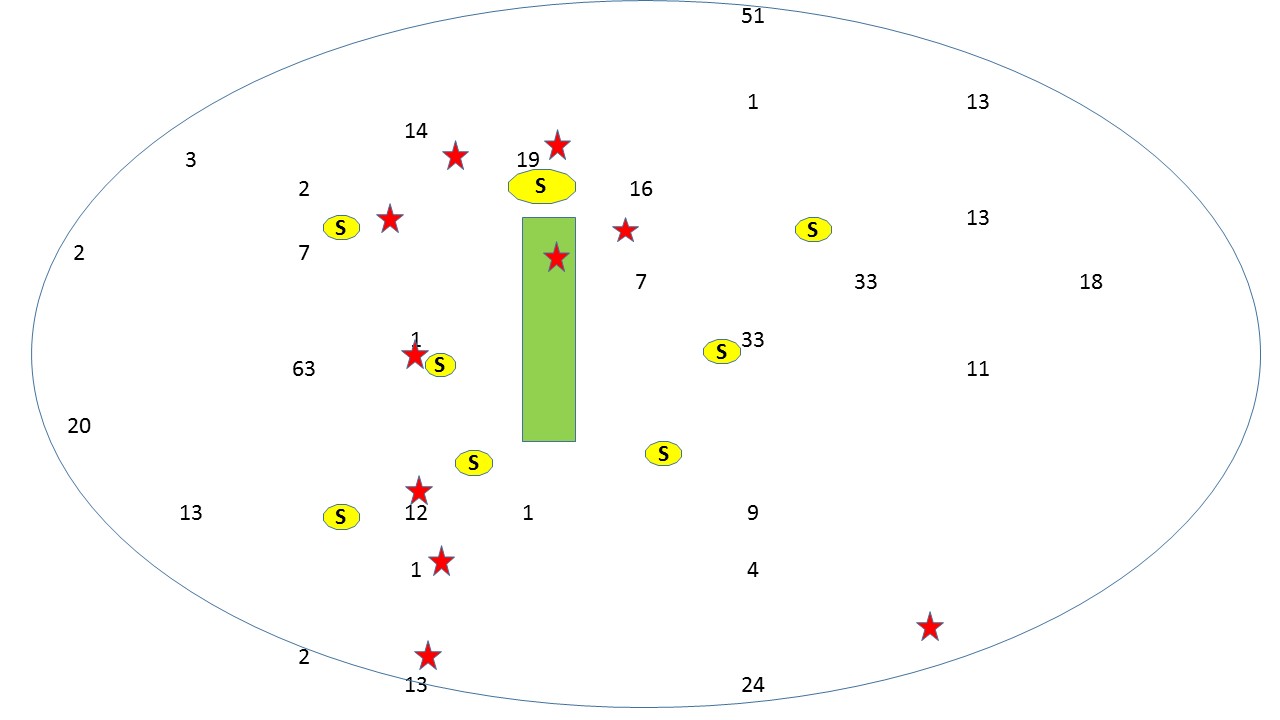
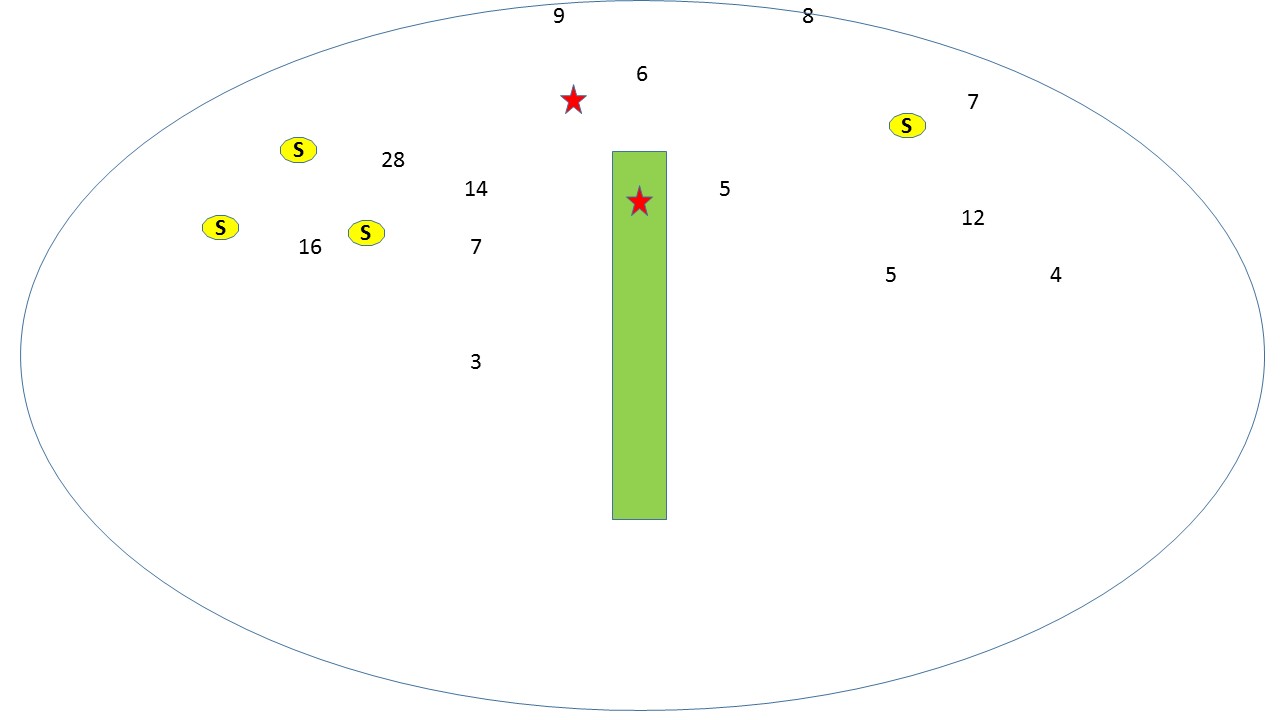
India scoring zone while playing horizontal and vertical shots
India lost only two wickets when playing horizontal shots and scored approx 139 plus runs. When playing vertical shots they lost 38 and scored only 382 runs. Surprisingly 16 wickets when playing defensive shot(7 front foot). So far Mathew Wade keeping has been extraordinary behind the stumps. He surprised all of us with his skills on variable condition(against pace and spin. His keeping to spin has been a revelation!.| The vertical shot analysis. Below gfx displays runs/wkt. |
|---|
 |
| Below gfx displays runs scored(while playing vertical shots)in each zone of the field. The red mark is where India lost their wickets(LBW, BOWLED is displayed in green zone,viz pitch),and the yellow mark is potential runs saved by Australian fielders |
 |
| The horizontal shot analysis. Below gfx displays runs/wkt. |
 |
| Below gfx displays runs scored(while playing horizontal shots) in each zone of the field. The red mark is where India lost their wickets(LBW, BOWLED is displayed in green zone,viz pitch),and the yellow mark is potential runs saved by Australian fielders. The Pujara Ranahe partnerships saw maximum runs scored behind square(both side of wicket) |
 |
Note – I was not able to record some part of these 2 tests, hence the above gfx displays only 75 % of H V shots. The runs which are not recorded is not used for this analysis.

