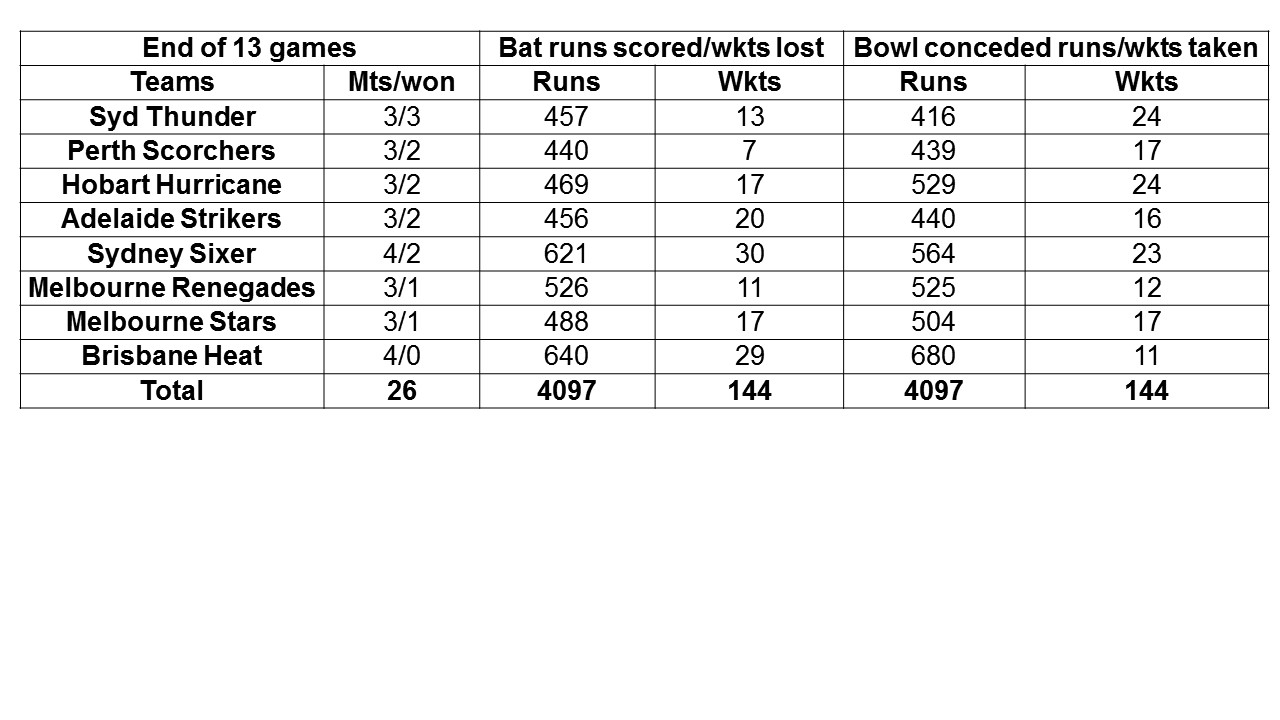
BBL 05- At end of 13th game (another 22 remaining) Sydney Thunder have done well not to lose a single game out of 3 played by them. Followed by Perth Scorchers, who won two, including thumping record breaking 10 wkt win against Adelaide Strikers on 30th Dec.
While it is too early to predict who will reach the last four – It is interesting to know that apart from Brisbane Heats, all teams have excellent Net Run-rate(batting R/O – bowling R/O).
Here is a brief analysis of all teams with primary indicators.
Table 1 – features batting and bowling runs/wkts.
In 3 games Perth Scorchers lost only 7 wickets(least for any team) and they along with Sydney Thunders look firm favourites to win the fifth edition of BBL.
Having said that, one believes Hobart Hurricanes and Sydney Sixer have an outside chance. Sixers are playing the 14th game, and have shuffled their batting order( Ed Cowan opening Brad Haddin push down). Along with Thunder both these teams have picked 20 plus wickets in 3 games.

Table 2 – In here along with primary batting indicators, i have added a special feature, viz No. of sixes hit by each teams, and batsmen getting out in deep field. Overall 33.33% of total wickets were dismissed at deep, and the ratio is 62.77/100 balls.
And one has to compare Ratio of balls faced against Ratio of catches taken in deep, than a very interesting data is exposed here. Perth Scorchers might have lost 42.86% of their wickets in deep, but the ratio is 107.7/100 balls!!.
Another interesting factor is that conversion of sixes are less -at this junction only 4.51/100 balls -with Renegades leading the pack at 6.16/100 balls. It suggest that teams are primarily focusing on hitting sixes and are getting out.


