
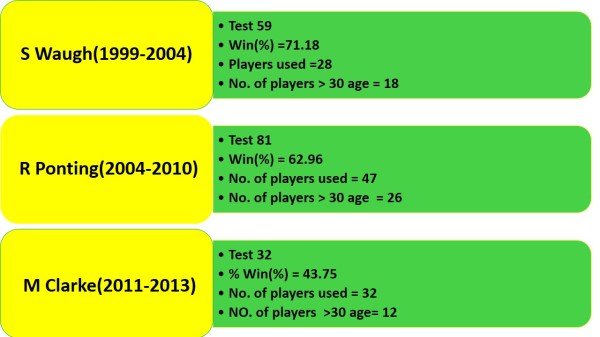
Australia fundamentally had 3 eras of Test captains since 1999.
In my last column I wrote about age factor being key for their success, and exposed how Australians perform better as they get older, with peak performance coming between age (27-35).
In this I would detail their age group (3 years slug) performance in each of batting/bowling position, led by 3 different captains’ between 1999-2013.
Since there is a myriad of data for this analysis, I have used relevant & simple stats for my analysis excluding players and only using age and Bat/Bowl post.
AGE GROUP
18-20 age group
21-23 age group
24-26 age group
27-29 age group
30-32 age group
33-35 age group
36-39 age group(4 years)
A Brief
When Tugga(Steve Waugh) led Australia, Ponting was the most successful young (24-26 age bracket) successful batsman to perform consistently. He use to bat at No.6, and excelled with Avg 80.00 in 16 Test inns. And he maintained his form in the next age group (26-29) scoring 13 Test centuries in 50 inns!. Ponting scored 18 centuries u/Waugh’s captaincy.
However his trump cards were the openers, who peaked when they reached 30. Hayden, Langer and Slater launched a start Tugga was looking for. Amongst them they scored 26 centuries after reaching age of 30. (overall 29 centuries scored by openers during Waugh’s captaincy 1999-2004)
Overall there were 90 centuries scored by Australians when Steve Waugh led Australia (59 Tests).
In 2002 Australia cricket team won the Laureus World Sports Awards.Kapil Dev was the sole cricketer on the jury, said, “It was hard to explain all members because they don’t follow cricket. I had to explain what the Australians had done had never happened in 200 years. “sixteen Test victories in a row”!!.
Steve Waugh adds, “It is nice to win but its more important to be remembered the way we played and the standards we set. We believe we changed the way Test cricket is played”.
Below is the whole read from The Australian newspaper.

Laures note PDF file
Here is a list Age Group
18-20 age group
21-23 age group
24-26 age group
27-29 age group
30-32 age group
33-35 age group
36-39 age group(4 years)
Minimum 10 Inns.
Steve Waugh captaincy
Age group (24-26)
| Bat # | Inn | Runs | 100s | 150s | Avg | B/W | St.Rate | Balls/ss | Avg overs/Inn |
| VI | 18 | 1059 | 4 | 1 | 75.64 | 136.71 | 55.33 | 3.58 | 36.37 |
| IX | 37 | 570 | 0 | 0 | 19.66 | 47.24 | 41.61 | 5.04 | 11.82 |
27-29 age group
| Bat # | Inn | Runs | 100s | 150s | Avg | B/W | St.Rate | Balls/ss | Avg overs/Inn |
| I | 29 | 783 | 1 | 29.00 | 66.26 | 43.77 | 4.78 | 19.26 | |
| II | 30 | 1051 | 1 | 37.54 | 94.82 | 39.59 | 5.15 | 28.36 | |
| III | 82 | 4730 | 10 | 8 | 63.92 | 105.50 | 60.59 | 3.41 | 31.39 |
| VI | 26 | 844 | 2 | 44.42 | 86.21 | 51.53 | 3.77 | 21.02 | |
| VII | 19 | 823 | 1 | 63.31 | 92.77 | 68.24 | 3.15 | 20.23 | |
| VIII | 12 | 258 | 23.45 | 38.91 | 60.28 | 3.66 | 11.38 | ||
| IX | 24 | 422 | 24.82 | 42.29 | 58.69 | 3.80 | 9.92 | ||
| X | 30 | 192 | 0 | 0 | 9.60 | 25.50 | 37.65 | 5.86 | 5.39 |
| XI | 18 | 109 | 10.90 | 21.00 | 51.90 | 3.96 | 4.20 |
30-32 age group
| Bat # | Inn | Runs | 100s | 150s | Avg | B/W | St.Rate | Balls/ss | Avg overs/Inn |
| I | 70 | 3108 | 8 | 1 | 47.09 | 79.32 | 59.37 | 3.69 | 24.40 |
| II | 69 | 3940 | 13 | 4 | 64.59 | 98.48 | 65.59 | 3.37 | 28.98 |
| III | 13 | 274 | 21.08 | 36.77 | 57.32 | 3.98 | 12.32 | ||
| IV | 16 | 613 | 43.79 | 88.50 | 49.48 | 4.23 | 25.52 | ||
| VI | 27 | 1100 | 4 | 45.83 | 80.63 | 56.85 | 3.52 | 24.35 | |
| VII | 42 | 2014 | 5 | 2 | 62.94 | 71.66 | 87.83 | 2.66 | 17.96 |
| VIII | 37 | 684 | 0 | 0 | 19.00 | 29.19 | 65.08 | 3.36 | 8.91 |
| X | 10 | 52 | 5.78 | 13.78 | 41.94 | 4.59 | 3.27 | ||
| XI | 37 | 146 | 6.35 | 15.39 | 41.24 | 4.78 | 3.28 |
33-35 age group
| Bat # | Inn | Runs | 100s | 150s | Avg | B/W | St.Rate | Balls/ss | Avg overs/Inn |
| IV | 37 | 1509 | 2 | 2 | 44.38 | 83.76 | 52.98 | 3.76 | 25.06 |
| V | 32 | 1346 | 3 | 3 | 48.07 | 100.93 | 47.63 | 4.00 | 30.04 |
| VII | 15 | 188 | 12.53 | 22.93 | 54.65 | 3.66 | 7.46 | ||
| VIII | 21 | 399 | 19.95 | 29.15 | 68.44 | 3.29 | 9.88 |
36-39 age group(4 years)
| Bat # | Inn | Runs | 100s | 150s | Avg | B/W | St.Rate | Balls/ss | Avg overs/Inn |
| IV | 31 | 1065 | 2 | 38.04 | 67.36 | 56.47 | 4.00 | 19.93 | |
| V | 46 | 2208 | 7 | 2 | 55.20 | 105.53 | 52.31 | 3.92 | 29.78 |
Ricky Ponting captaincy
21-23 age group
| Bat # | Inn | Runs | 100s | 150s | Avg | B/W | St.Rate | Balls/ss | Avg overs/Inn |
| I | 11 | 578 | 1 | 1 | 57.80 | 90.50 | 63.87 | 3.56 | 23.91 |
| VI | 15 | 571 | 1 | 1 | 38.07 | 68.80 | 55.33 | 3.82 | 21.91 |
24-26 age group
| Bat # | Inn | Runs | 100s | 150s | Avg | B/W | St.Rate | Balls/ss | Avg overs/Inn |
| V | 19 | 874 | 2 | 51.41 | 91.47 | 56.21 | 3.58 | 26.93 | |
| VII | 12 | 360 | 30.00 | 71.33 | 42.06 | 4.65 | 22.41 | ||
| VIII | 10 | 210 | 0 | 0 | 26.25 | 59.63 | 44.03 | 4.08 | 14.98 |
| IX | 10 | 147 | 18.38 | 31.50 | 58.33 | 4.13 | 8.95 | ||
| X | 19 | 262 | 18.71 | 39.07 | 47.90 | 4.38 | 9.80 | ||
| XI | 21 | 134 | 0 | 0 | 9.57 | 19.71 | 48.55 | 4.93 | 4.16 |
27-29 age group
| Bat # | Inn | Runs | 100s | 150s | Avg | B/W | St.Rate | Balls/ss | Avg overs/Inn |
| I | 49 | 2403 | 4 | 1 | 51.13 | 97.45 | 52.47 | 3.93 | 29.89 |
| IV | 19 | 364 | 19.16 | 42.42 | 45.16 | 4.48 | 13.62 | ||
| V | 52 | 2556 | 7 | 2 | 55.57 | 108.46 | 51.23 | 3.72 | 31.90 |
| VI | 21 | 361 | 18.05 | 47.65 | 37.88 | 5.12 | 15.17 | ||
| VIII | 33 | 610 | 1 | 20.33 | 35.37 | 57.49 | 4.13 | 10.24 | |
| IX | 62 | 1021 | 23.74 | 46.72 | 50.82 | 4.19 | 10.12 | ||
| X | 30 | 430 | 0 | 0 | 18.70 | 32.91 | 56.80 | 4.03 | 7.76 |
| XI | 19 | 79 | 7.90 | 21.00 | 37.62 | 6.00 | 4.90 |
30-32 age group
| Bat # | Inn | Runs | 100s | 150s | Avg | B/W | St.Rate | Balls/ss | Avg overs/Inn |
| III | 61 | 3560 | 10 | 4 | 71.20 | 118.60 | 60.03 | 3.24 | 31.80 |
| IV | 19 | 870 | 3 | 58.00 | 111.07 | 52.22 | 3.64 | 28.84 | |
| V | 24 | 1253 | 2 | 2 | 62.65 | 116.95 | 53.57 | 3.80 | 30.48 |
| VI | 64 | 2038 | 5 | 33.97 | 66.45 | 51.12 | 3.96 | 20.47 | |
| VII | 39 | 1647 | 2 | 2 | 48.44 | 83.18 | 58.24 | 3.66 | 23.87 |
| VIII | 19 | 283 | 16.65 | 36.82 | 45.21 | 5.13 | 9.87 | ||
| IX | 30 | 423 | 18.39 | 43.43 | 42.34 | 5.12 | 10.37 | ||
| X | 32 | 241 | 8.61 | 17.50 | 49.18 | 4.05 | 5.49 |
33-35 age group
| Bat # | Inn | Runs | 100s | 150s | Avg | B/W | St.Rate | Balls/ss | Avg overs/Inn |
| I | 69 | 3004 | 4 | 4 | 46.94 | 83.89 | 55.95 | 3.64 | 25.37 |
| II | 127 | 5772 | 14 | 2 | 48.10 | 91.78 | 52.41 | 3.81 | 29.32 |
| III | 57 | 2419 | 4 | 2 | 43.98 | 70.04 | 62.80 | 3.32 | 22.85 |
| IV | 98 | 3872 | 9 | 2 | 43.02 | 90.81 | 47.38 | 4.14 | 27.02 |
| V | 41 | 1739 | 3 | 2 | 44.59 | 77.67 | 57.41 | 3.45 | 24.62 |
| VI | 27 | 1043 | 2 | 1 | 41.72 | 62.56 | 66.69 | 3.27 | 18.91 |
| VII | 54 | 1807 | 4 | 1 | 37.65 | 50.38 | 74.73 | 2.94 | 14.85 |
| VIII | 24 | 501 | 1 | 23.86 | 37.24 | 64.07 | 3.33 | 9.80 | |
| X | 24 | 244 | 13.56 | 21.33 | 63.54 | 3.31 | 5.69 | ||
| XI | 41 | 260 | 13.68 | 25.05 | 54.62 | 3.87 | 4.53 |
36-39 age group(4 years)
| Bat # | Inn | Runs | 100s | 150s | Avg | B/W | St.Rate | Balls/ss | Avg overs/Inn |
| I | 19 | 429 | 25.24 | 41.88 | 60.25 | 3.85 | 11.84 | ||
| II | 10 | 559 | 3 | 62.11 | 102.78 | 60.43 | 2.50 | 31.51 | |
| III | 23 | 813 | 36.95 | 64.91 | 56.93 | 3.44 | 21.29 | ||
| VII | 13 | 383 | 31.92 | 44.67 | 71.46 | 2.78 | 13.37 | ||
| VIII | 28 | 589 | 0 | 0 | 24.54 | 35.21 | 69.70 | 2.98 | 10.54 |
Michael Clarke Test captaincy
21-23 age group
| Bat # | Inn | Runs | 100s | 150s | Avg | B/W | St.Rate | Balls/ss | Avg overs/Inn |
| II | 13 | 377 | 1 | 29.00 | 58.23 | 49.80 | 4.56 | 18.78 | |
| IX | 16 | 375 | 28.85 | 45.00 | 64.10 | 3.38 | 11.10 | ||
| X | 16 | 303 | 0 | 0 | 33.67 | 71.67 | 46.98 | 4.27 | 12.76 |
24-26 age group
| Bat # | Inn | Runs | 100s | 150s | Avg | B/W | St.Rate | Balls/ss | Avg overs/Inn |
| I | 11 | 310 | 1 | 0 | 28.18 | 39.55 | 71.26 | 3.32 | 12.02 |
| II | 14 | 681 | 1 | 1 | 56.75 | 76.25 | 74.43 | 3.04 | 22.31 |
| III | 18 | 575 | 0 | 33.82 | 72.18 | 46.86 | 4.37 | 21.56 | |
| V | 12 | 514 | 1 | 46.73 | 97.73 | 47.81 | 4.09 | 30.28 | |
| VI | 17 | 393 | 1 | 0 | 26.20 | 54.60 | 47.99 | 3.67 | 15.81 |
| VII | 18 | 485 | 1 | 0 | 34.64 | 70.86 | 48.89 | 3.67 | 17.28 |
| X | 11 | 83 | 0 | 0 | 10.38 | 23.25 | 44.62 | 5.64 | 5.33 |
| XI | 23 | 173 | 0 | 0 | 17.30 | 48.30 | 35.82 | 5.89 | 6.71 |
27-29 age group
| Bat # | Inn | Runs | 100s | 150s | Avg | B/W | St.Rate | Balls/ss | Avg overs/Inn |
| II | 12 | 458 | 1 | 0 | 38.17 | 61.83 | 61.73 | 3.37 | 22.68 |
| III | 17 | 438 | 1 | 25.76 | 62.29 | 41.36 | 4.71 | 21.04 | |
| VIII | 19 | 215 | 0 | 0 | 11.32 | 24.95 | 45.36 | 4.74 | 7.67 |
| IX | 21 | 307 | 0 | 0 | 17.06 | 36.61 | 46.59 | 4.31 | 10.58 |
| X | 11 | 158 | 0 | 0 | 15.80 | 30.00 | 52.67 | 4.17 | 8.94 |
30-32 age group
| Bat # | Inn | Runs | 100s | 150s | Avg | B/W | St.Rate | Balls/ss | Avg overs/Inn |
| I | 32 | 1107 | 1 | 0 | 34.59 | 73.72 | 46.93 | 4.50 | 23.97 |
| II | 13 | 216 | 0 | 0 | 16.62 | 39.92 | 41.62 | 4.59 | 13.72 |
| III | 18 | 479 | 0 | 1 | 26.61 | 53.28 | 49.95 | 4.17 | 17.38 |
| IV | 24 | 793 | 1 | 1 | 33.04 | 61.17 | 54.02 | 3.64 | 20.30 |
| V | 35 | 2418 | 4 | 5 | 75.56 | 121.28 | 62.30 | 3.24 | 36.79 |
| VIII | 16 | 386 | 32.17 | 52.67 | 61.08 | 3.34 | 12.01 |
33-35 age group
| Bat # | Inn | Runs | 100s | 150s | Avg | B/W | St.Rate | Balls/ss | Avg overs/Inn |
| VII | 17 | 353 | 23.53 | 44.80 | 52.53 | 3.95 | 13.31 |
36-39 age group(4 years)
| Bat # | Inn | Runs | 100s | 150s | Avg | B/W | St.Rate | Balls/ss | Avg overs/Inn |
| IV | 25 | 963 | 1 | 1 | 40.13 | 76.88 | 52.20 | 3.54 | 24.70 |
| VI | 26 | 1205 | 4 | 1 | 50.21 | 89.92 | 55.84 | 3.45 | 28.92 |
| VII | 15 | 480 | 0 | 0 | 34.29 | 62.07 | 55.24 | 3.32 | 20.75 |
Bowling Performance for following age group
18-20 age group
21-23 age group
24-26 age group
27-29 age group
30-32 age group
33-35 age group
36-39 age group(4 years)
Minimum 10 Inns.
Steve Waugh’s Captaincy
24-26 age group
| Bowl# | Inns | Balls | runs | wkts | 4wi | 5wi | Avg | B/W | R/O | LER x LSR | Mdns(%) |
| 2 | 55 | 5993 | 2969 | 109 | 2 | 6 | 27.24 | 54.98 | 3.00 | 165.01 | 26.28 |
| 3 | 18 | 1741 | 1117 | 40 | 3 | 1 | 27.93 | 43.53 | 3.85 | 167.76 | 18.29 |
| 4 | 14 | 1290 | 712 | 17 | 0 | 1 | 41.88 | 75.88 | 3.31 | 251.29 | 22.33 |
27-29 age group
| Bowl# | Inns | Balls | runs | wkts | 5wi/10 | Avg | B/W | R/O | LER x LSR | Mdns(%) |
| 1 | 41 | 5356 | 2568 | 93 | 4-2 | 27.61 | 57.59 | 2.88 | 166.10 | 27.74 |
| 2 | 44 | 5071 | 2336 | 99 | 2 | 23.60 | 51.22 | 2.77 | 142.07 | 26.72 |
| 3 | 24 | 2205 | 1275 | 40 | 0 | 31.88 | 55.13 | 3.43 | 189.19 | 23.15 |
| 4 | 15 | 1412 | 773 | 27 | 2 | 28.63 | 52.30 | 3.29 | 172.24 | 21.30 |
| 5 | 21 | 804 | 463 | 10 | 0 | 46.30 | 80.40 | 3.46 | 277.80 | 19.40 |
30-32 age group
| Bowl# | Inns | Balls | runs | wkts | 5wi/10wk/mt | Avg | B/W | R/O | LER x LSR | Mdns(%) |
| 1 | 65 | 7550 | 3033 | 153 | 8-4 | 19.82 | 49.35 | 2.41 | 118.95 | 33.62 |
| 2 | 12 | 1185 | 564 | 15 | 1 | 37.60 | 79.00 | 2.86 | 225.83 | 29.90 |
| 3 | 41 | 5418 | 2684 | 94 | 8-3 | 28.55 | 57.64 | 2.98 | 171.68 | 22.42 |
| 4 | 57 | 7294 | 3681 | 120 | 6-1 | 30.68 | 60.78 | 3.04 | 184.49 | 22.51 |
33-35 age group
| Bowl# | Inns | Balls | runs | wkts | 5wi | Avg | B/W | R/O | LER x LSR | Mdns(%) |
| 3 | 22 | 2801 | 1351 | 54 | 2 | 25.02 | 51.87 | 2.89 | 150.12 | 22.92 |
| 4 | 21 | 2431 | 1212 | 52 | 1-2 | 23.31 | 46.75 | 3.00 | 140.08 | 22.25 |
| 5 | 10 | 554 | 248 | 5 | 0 | 49.60 | 110.80 | 2.69 | 298.03 | 30.37 |
36-39 age group(4 years)
| Bowl# | Inns | Balls | runs | wkts | 5wi | Avg | B/W | R/O | LER x LSR | Mdns(%) |
| 5 | 26 | 797 | 369 | 10 | 1 | 36.90 | 79.70 | 2.78 | 221.96 | 24.15 |
| 6 | 12 | 426 | 223 | 2 | 0 | 111.50 | 213.00 | 3.14 | 669.00 | 12.68 |
Ricky Ponting’s Test captaincy
24-26 age group
| Bowl# | Inns | Balls | runs | wkts | 5wi | Avg | B/W | R/O | LER x LSR | Mdns(%) |
| 1 | 12 | 1296 | 663 | 30 | 1 | 22.10 | 43.20 | 3.07 | 132.60 | 29.17 |
| 2 | 35 | 3818 | 1962 | 61 | 3 | 32.16 | 62.59 | 3.08 | 193.08 | 22.80 |
| 3 | 21 | 2289 | 1277 | 27 | 2-1 | 47.30 | 84.78 | 3.35 | 284.00 | 18.10 |
| 4 | 14 | 1236 | 753 | 21 | 3-1 | 35.86 | 58.86 | 3.67 | 215.77 | 15.09 |
| 5 | 11 | 534 | 314 | 3 | 0 | 104.67 | 178.00 | 3.53 | 628.00 | 13.48 |
27-29 age group
| Bowl# | Inns | Balls | runs | wkts | 4wi | 5wi | Sum of 10w/mt | Avg | B/W | R/O | LER x LSR | Mdns(%) | |
| 1 | 48 | 5513 | 2878 | 93 | 6 | 6 | 30.95 | 59.28 | 3.14 | 185.87 | 19.83 | ||
| 2 | 67 | 7601 | 4096 | 144 | 7 | 5 | 2 | 28.44 | 52.78 | 3.21 | 169.27 | 20.43 | |
| 3 | 52 | 5166 | 2894 | 87 | 3 | 7 | 1 | 33.26 | 59.38 | 3.37 | 200.05 | 18.86 | |
| 4 | 57 | 5881 | 3020 | 108 | 3 | 5 | 1 | 27.96 | 54.45 | 3.05 | 165.88 | 21.48 | |
| 5 | 43 | 2985 | 1568 | 27 | 0 | 4 | 58.07 | 110.56 | 3.15 | 348.44 | 17.69 | ||
| 6 | 20 | 801 | 405 | 10 | 0 | 0 | 40.50 | 80.10 | 3.03 | 243.00 | 17.23 | ||
30-32 age group
| Bowl# | Inns | Balls | runs | Wkts | 4wi | 5wi | Avg | B/W | R/O | LER x LSR | Mdns(%) |
| 1 | 55 | 6489 | 3473 | 117 | 7 | 5 | 29.68 | 55.46 | 3.22 | 178.43 | 19.08 |
| 2 | 35 | 3576 | 1862 | 65 | 4 | 3 | 28.65 | 55.02 | 3.13 | 172.22 | 21.69 |
| 3 | 45 | 4219 | 1937 | 79 | 4 | 2 | 24.52 | 53.41 | 2.72 | 145.17 | 24.84 |
| 4 | 19 | 1272 | 565 | 22 | 1 | 2 | 25.68 | 57.82 | 2.67 | 154.09 | 25.00 |
| 5 | 26 | 1059 | 479 | 9 | 0 | 0 | 53.22 | 117.67 | 2.72 | 319.70 | 22.69 |
| 6 | 11 | 461 | 255 | 9 | 0 | 2 | 28.33 | 51.22 | 2.93 | 149.96 | 16.07 |
33-35 age group
| Bowl# | Inns | Balls | runs | Wkts | 4wi | 5wi | Avg | B/W | R/O | LER x LSR | Mdns(%) |
| 1 | 46 | 5284 | 2234 | 112 | 8 | 6 | 19.95 | 47.18 | 2.51 | 118.49 | 30.35 |
| 2 | 17 | 1710 | 765 | 24 | 1 | 1 | 31.88 | 71.25 | 2.68 | 191.25 | 25.61 |
| 3 | 29 | 3607 | 1850 | 60 | 3 | 4 | 30.83 | 60.12 | 3.08 | 185.27 | 20.66 |
| 4 | 25 | 2747 | 1444 | 60 | 4 | 1 | 24.07 | 45.78 | 3.16 | 144.89 | 20.60 |
| 5 | 32 | 2152 | 1078 | 41 | 1 | 2 | 26.29 | 52.49 | 3.01 | 157.87 | 17.58 |
| 6 | 20 | 800 | 451 | 15 | 0 | 1 | 30.07 | 53.33 | 3.39 | 180.58 | 16.52 |
36-39 age group(4 years)
| Bowl# | Inns | Balls | runs | Wkts | 4wi | 5wi | Avg | B/W | R/O | LER x LSR | Mdns(%) |
| 3 | 14 | 2088 | 972 | 39 | 4 | 2 | 24.92 | 53.54 | 2.80 | 149.88 | 19.87 |
| 4 | 44 | 6098 | 3401 | 109 | 8 | 7 | 31.20 | 55.94 | 3.35 | 187.31 | 16.14 |
Michael Clarke’s captaincy
21-23 age group
| Bowl# | inns | balls | runs | Wkts | 4wi | 5wi | avg | b/w | r/o | ler lsr | % mdns |
| 1 | 23 | 2752 | 1599 | 57 | 2 | 4 | 28.05 | 48.28 | 3.49 | 168.71 | 19.01 |
| 2 | 12 | 1287 | 662 | 21 | 0 | 1 | 31.52 | 61.29 | 3.09 | 189.32 | 19.13 |
24-26 age group
| Bowl# | inns | balls | runs | Wkts | 4wi | 5wi | avg | b/w | r/o | ler lsr | % mdns |
| 4 | 24 | 2917 | 1472 | 46 | 2 | 2 | 32.00 | 63.41 | 3.04 | 192.66 | 22.91 |
| 5 | 23 | 2096 | 1164 | 33 | 3 | 0 | 35.27 | 63.52 | 3.34 | 211.96 | 15.48 |
27-29 age group
| Bowl# | inns | balls | runs | wkts | 4wi | 5wi | avg | b/w | r/o | ler lsr | % mdns |
| 2 | 28 | 3554 | 1577 | 71 | 6 | 3 | 22.21 | 50.06 | 2.67 | 133.57 | 28.93 |
| 3 | 23 | 2155 | 1126 | 41 | 0 | 2 | 27.46 | 52.56 | 3.14 | 165.18 | 24.00 |
| 4 | 12 | 1533 | 780 | 20 | 0 | 1 | 39.00 | 76.65 | 3.06 | 234.92 | 26.33 |
30-32 age group
| Bowl# | inns | balls | runs | Wkts | 4wi | 5wi | avg | b/w | r/o | ler lsr | % mdns |
| 1 | 11 | 1054 | 551 | 23 | 2 | 1 | 23.96 | 45.83 | 3.14 | 143.96 | 24.52 |
| 3 | 17 | 1440 | 699 | 15 | 1 | 0 | 46.60 | 96.00 | 2.92 | 280.07 | 22.12 |
| 4 | 13 | 1115 | 544 | 17 | 0 | 1 | 32.00 | 65.59 | 2.93 | 192.14 | 28.00 |
| 5 | 13 | 772 | 351 | 11 | 0 | 1 | 31.91 | 70.18 | 2.73 | 191.85 | 25.70 |
| 6 | 13 | 480 | 162 | 4 | 0 | 0 | 40.50 | 120.00 | 2.03 | 243.00 | 36.25 |
33-35 age group
| Bowl# | inns | balls | runs | Wkts | 4wi | 5wi | avg | b/w | r/o | ler lsr | % mdns |
| 1 | 13 | 1495 | 673 | 30 | 0 | 1 | 22.43 | 49.83 | 2.70 | 134.64 | 23.69 |
36-39 age group(4 years)
| Bowl# | inns | balls | runs | Wkts | 4wi | 5wi | avg | b/w | r/o | ler lsr | % mdns |
| 6 | 11 | 168 | 84 | 2 | 0 | 0 | 42.00 | 84.00 | 3.00 | 252.00 | 17.86 |
Photo courtesy: The Australian(www.theaustralian.com.au),dated May 16, 2002.
Here is a link to meaning of all ndicators/formula – http://allthatcricket.com/?p=1489
