Before the start of the World Cup one thought (like Bangladesh) their batsmen would have problem scoring runs on fast/bouncy surface.
This thought was justified by the recent poor batting performance (since Nov 2012)across all indices. Bat Average @22.51, R/O- 4.53, and Scoring rate 38.07.
In this WC all this changed drastically(against formidable opponents)-the Average climbed to 30.0, the run rate rose to 5.84, and boundary rate- 47.37!!.
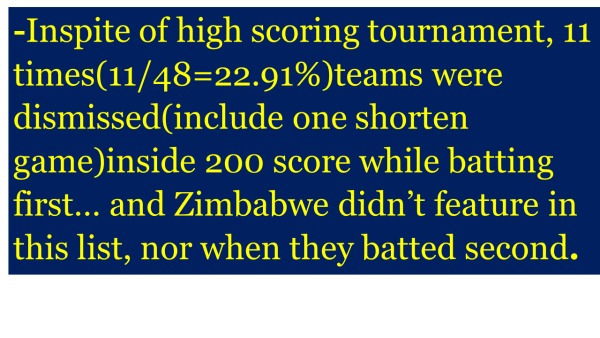
-Inspite of high scoring tournament, while batting first 11 times(11/48=22.91%)teams were dismissed(include one shorten game)inside 200 score… Zimbabwe didn’t feature in this list, nor when they batted second.
Nevertheless they won only 1 game… as they manage to pick only 32 wickets in 6 games-least by any team in this WC-
Like batting, their bowling has also been a concern -before the WC the average was 40.49 and that jumped to 58 most runs/wkts by any team. They have been bowling very economically in first 10 overs, and if they can maintain similar run-rate till the 40th over…than they can restrict teams to total that they can chase or defend effectively.
To conclude this post, both both Zimbabwe and Bangladesh batting has improved leaps and bounds, and it’s an X FACTOR to win matches. Score more runs than your opponent, either batting first or chasing, you will win!.
| Zimbabwe – Mts 6, won 1 | Batting | Bowling | Gap between bat and bowl |
| Runs scored/conceded | 1680 | 1850 | -170 |
| Wkts lost/taken | 56 | 32 | -24 |
| Avg | 30.00 | 57.81 | -27.81 |
| R/o | 5.84 | 6.20 | -0.36 |
| Scoring rate | 47.37 | 50.67 | -3.3 |
| Boundary rate | 10.79 | 10.83 | -0.04 |
| Centuries | 2 | 6 | -4 |
| Top 4 batsmen(contribution) | 40.83 | 51.29 | -10.46 |
| Eco rate | |||
| Maiden over | 4.17 | 4.02 | -0.15 |
| Consecutive < 4 runs/overs (C 4) | 21.20 | 20.78 | -0.42 |
| < 4 runs/over (L 4) | 46.92 | 43.23 | -3.69 |
| >6 runs /over (6+) | 47.27 | 47.59 | -0.32 |
| >10 runs/over (10+) | 14.25 | 16.08 | -1.83 |
| Powerplay(Batting) | |||
| Avg | 26.10 | 21.70 | 4.4 |
| R/O | 4.40 | 3.30 | 1.1 |
| Scoring rate | 34.00 | 23.90 | 10.1 |
| Boundary rate | 10.70 | 6.40 | 4.3 |
| Maiden over | 11.70 | 6.40 | -5.3 |
| Consecutive < 4 runs/overs (C 4) | 31.70 | 46.70 | 15 |
| < 4 runs/over (L 4) | 58.30 | 73.30 | 15 |
| >6 runs /over (6+) | 30.00 | 15.00 | 15 |
| >10 runs/over (10+) | 5.00 | 3.30 | 1.7 |
| Powerplay(second ) | |||
| Avg | 24.80 | 127.50 | -102.7 |
| R/O | 6.60 | 8.50 | -1.9 |
| Scoring rate | 62.0 | 62.80 | -0.8 |
| Boundary rate | 14.00 | 16.70 | -2.7 |
| Maiden over | 0.00 | 0 | 0 |
| Consecutive < 4 runs/overs (C 4) | 23.30 | 3.30 | -20 |
| < 4 runs/over (L 4) | 40.00 | 20.00 | -20 |
| >6 runs /over (6+) | 56.70 | 73.30 | -16.6 |
| >10 runs/over (10+) | 20.00 | 33.33 | -13.33 |
| Partnerships | Bat | Bowl |
| Partnerships (>100 runs) | 3 | 4 |
| Opening stand avg | 27.33 | 12.33 |
| (>100 runs) top order(I,II, III) | 1 | 2 |
| (> 100) middle order(IV,V, VI) | 2 | 2 |
| (>50s) lower order(VII, VIII, IX, X) | 0 | 1 |
| Method of dismissals | Bat | Bowl |
| LBW | 8.92 | 0 |
| Bowled | 10.71 | 21.87 |
| Run out | 3.57 | 6.25 |
links to all the stats indicators http://allthatcricket.com/?p=1489


