I hope i got the meaning of Kutandanisa correct?. In Zimbawean it means chasing, hence i used this word here.
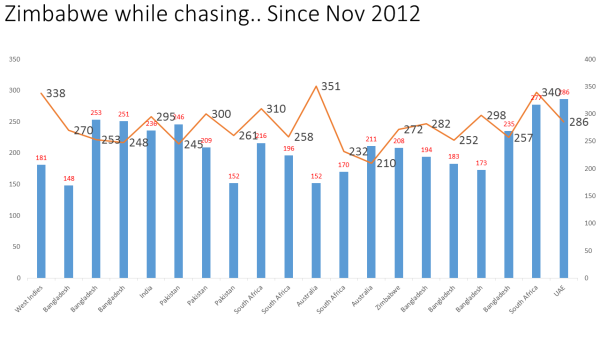
Here is why Zimbabwe prefers to chase. Below gfx -Zimbabwe’s scores while chasing –
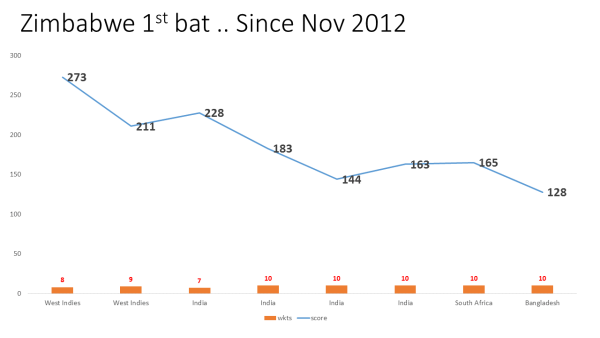
When they bat first they haven’t won a single game in last 2 years. Here is series-wise table.
| 1st bat since Nov 2012 (serieswise) | Mts | Won | Avg | r/o | Scoring rate/100 balls | Boundary rate/100balls |
| Zim in WI | 2 | 0 | 28.47 | 4.84 | 41.67 | 7.50 |
| Ind in Zim | 4 | 0 | 19.41 | 4.04 | 32.31 | 7.10 |
| SA in Zimb | 1 | 0 | 16.50 | 4.18 | 31.80 | 8.37 |
| Zim in Bang | 1 | 0 | 12.80 | 4.27 | 35.56 | 8.33 |
| Total | 8 | 0 | 20.20 | 4.30 | 35.22 | 7.46 |
From above table it is very clear their batting tapered – only one hundred partnership and individual performance there were no hundreds and only 8 fifties!. Their best partnership average is 29.00 for 4th wkt.
Adding to this the most incredible stats for me is 58.10% were dismissed for low scores(under-10 runs), and 50.00% were dismissed (L B W + Bowled) with 30.00% for low scores!.
And when they chase – there is a huge difference in their batting (see the last row of World Cup stats). Here is series-wise table
| 2nd bat since Nov 2012 | Mts | Won | Avg | R/o | Scoring rate/100 balls | Boundary rate/100balls |
| Zim in WI | 1 | 0 | 20.11 | 3.62 | 30.67 | 5.67 |
| Ban in Zim | 3 | 2 | 38.35 | 5.15 | 45.22 | 9.31 |
| Ind in Zim | 1 | 0 | 26.22 | 4.72 | 39.33 | 7.67 |
| Pak in Zim | 3 | 1 | 26.39 | 4.65 | 43.38 | 8.02 |
| SA in Zimb | 2 | 0 | 20.60 | 4.18 | 35.69 | 7.07 |
| Tri Series in Zim(Aus & SA) | 4 | 1 | 20.03 | 4.29 | 37.02 | 7.02 |
| Zim in Bang | 4 | 0 | 20.66 | 4.46 | 38.74 | 7.73 |
| World Cup | 2 | 1 | 35.19 | 5.85 | 47.23 | 11.42 |
| Total | 20 | 4 | 24.72 | 4.64 | 40.15 | 8.06 |
While batting second they at least score one fifty/game, and also get a decent start to opening wicket(29)which does not taper.
Although in these 20 chases they had only 5wins, because most of the times(16/20=80.00%) they are asked to chase more than 250 score. And from below table it is very clear chasing over 250 is never easy. Only Test playing nations in this table.
| 2nd bat(since Nov 2012) | 2nd bat | Asked to chase >250 target | Successful chasing >250 target |
| India | 36 | 21 | 7 (33.33 %) |
| Sri Lanka | 35 | 15 | 5 (33.33%) |
| Pakistan | 27 | 14 | 2 (14.29%) |
| West Indies | 27 | 13 | 3 (23.08%) |
| England | 26 | 14 | 2 (14.29%) |
| New Zealand | 24 | 10 | 4 (40.00%) |
| South Africa | 21 | 11 | 2 (18.18%) |
| Zimbabwe | 20 | 16 | 2 (12.50%) |
| Australia | 18 | 11 | 7(63.64%) |
| Bangladesh | 14 | 4 | 1(25.00%) |
| All data till end of 8th World Cup game | 248 | 129 | 35(27.13%) |
– Below gfx is how Zimb scores tapered when they batted first.


