India in Australia -2016
At end of 2 games only 19 combined wickets fell, suggesting batting paradise for teams.Hence I was keen to know how scoring rates were distributed in each phase.
Interestingly India’s run rate(6.06 v 5.70) and boundary rate is marginally higher(9.98 v 8.31) than Australia.
Here is graphic based of each scoring shot in each phase for both teams.
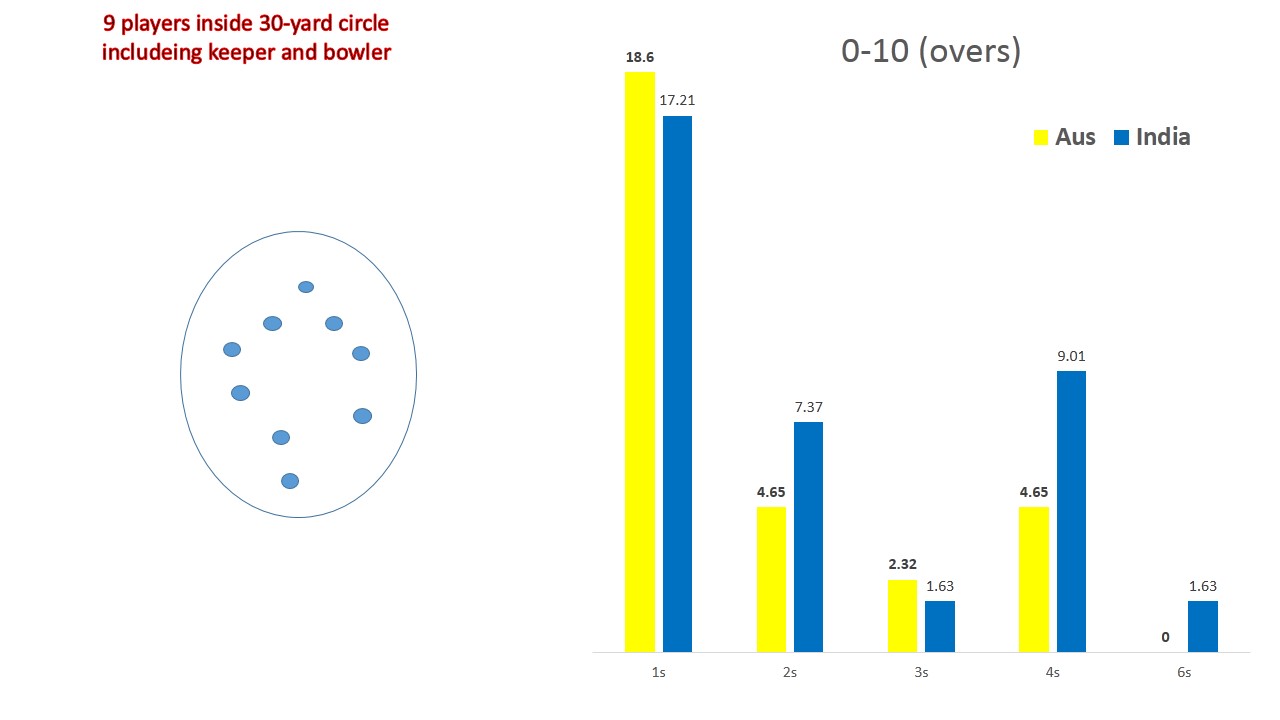
1- First powerplay(0-10)overs
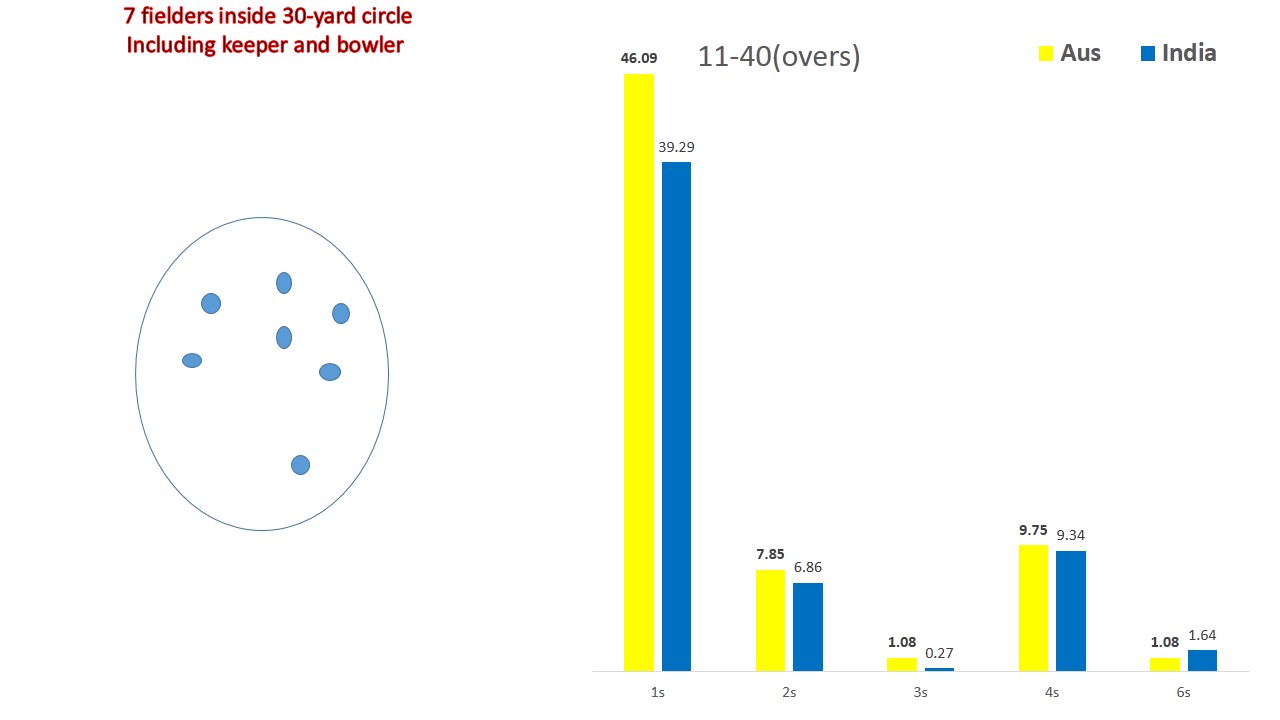
2- second powerplay(11-40)overs
3- third powerplay (41-50)overs

Both teams scoring rate/100 balls

